
Last time out, I explained the method I would be using to project the records for the 2013–14 season. There was a lot of dense explanation that I won’t cover again in this post. You can re-read it here. This post will be about updating the method to take into account new research from Jeremias Englemann on aging and RAPM and also to try to project the new rookies entering the league based on projections done over at Hickory High by Cole Patty, Jacob Frankel, and Jam Draper. Finally, I’ll show the updated results for the Bulls and also discuss what this off-season’s biggest splash-makers, the Brooklyn Nets, should look like provided their health holds up.
First up, aging. Aging affects performance, obviously. It cuts both ways. As players get stronger and smarter when they are younger, they tend to perform better year over year. Eventually, usually at around age 30 or so, they start to decline, due to the negative affects of aging and a lifetime of basketball played. Jeremias Engelmann wanted to know the effects of aging on average performance under RAPM. So he did some research and came up with the following graph:
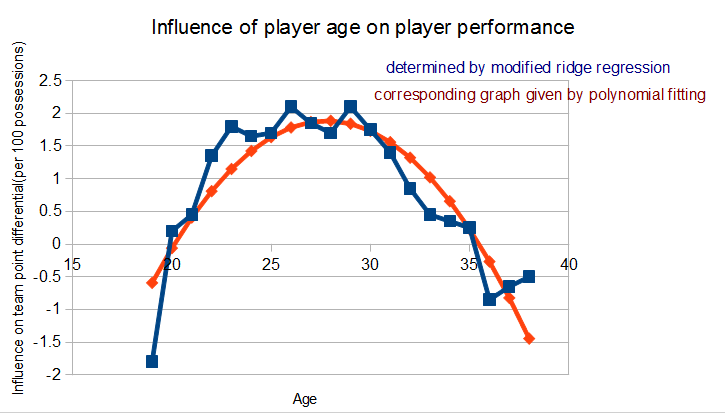
As a result of that graph, I decided to add adjustments to the xRAPM of each member of every team based on the expected change in their performance based on the change in their age. Here are the numbers that I used, based on an eyeballing of the graph provided by Jeremias:
Age 19 to 20 = +.6
20 to 21 = +.4
21 to 22 = +.4
22 to 23 = +.35
23 to 24 = +.3
24 to 25 = +.15
25 to 26 = +.1
26 to 27 through 28 to 29 = 0
29 to 30 = -.1
30 to 31 = -.2
31 to 32 = -.2
32 to 33 = -.3
33 to 34 = -.4
34 to 35 = -.4
35 to 36 = -.6
36 to 37 = -.6
37 to 38 = -.75
Second, I wanted to try to get a projection of what rookie performance for this year might look like. I looked around for projections in RAPM of the incoming rookie class and the closest thing I found was 4 years in the league RAPM projections done by the guys at Hickory High mentioned earlier. Unfortunately, 4 year in projections don’t help me for projecting the league for this year. So I subtracted out the RAPM performance bumps those players would have expected to receive via the aging curve over the 3 seasons following their rookie year from their 4th-year RAPM projections to try to approximate a guess as to what their production might look like for this year. It is, admittedly, a janky solution. But it’s the best I could figure for the time being. If I find a better solution, I will change things and post updated results.
Okay, now on to the more fun stuff: projecting the Bulls and the Nets with the updated method.
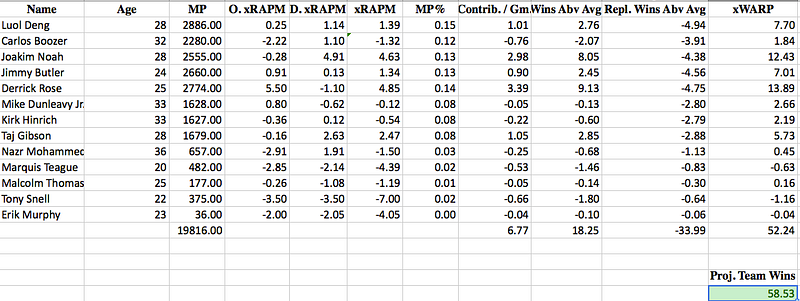
The Bulls look more or less the same as I had previously suggested. Tony Snell’s projection is much worse as the 4-year RAPM projection had him as one of the worst projected players drafted. Erik Murphy looks about the same as I had projected him last time. I don’t expect either of them to play significant minutes so this change had little effect on the Bulls estimated win total. I believe Derrick Rose will play his normal level of minutes as he has had plenty of rest and should be back, better than ever. Rose, Jimmy Butler, and Marquis Teague project to have improvements based on their ages which helps the Bulls, while Carlos Boozer, Mike Dunleavy, and Kirk Hinrich all project to decline slightly. The rest of the major minutes contributors should be more or less the same. As a result, I have the Bulls pegged at about 58 to 59 wins, which is right in between where my two earlier projections of 57 and 60 wins would suggest. So the age adjustment did not make a huge difference for the Bulls.
One team for whom the aging adjustment did matter was the Brooklyn Nets. Prior to age adjusting their roster, the Nets looked like a 63 win team. This is how their projection shook out:

After adjusting for age, however, the Nets still look great. They project as a 60 win team, provided they stay reasonably healthy. I made a point of keeping Kevin Garnett’s minutes low relative to his career average, as he has stated in interviews that he can no longer handle the heavy minutes loads that he has been tasked with his whole career. The good news, for Garnett and Nets fans, is that it looks like he will not need to be asked to handle such heavy minutes. The Nets appear to be a juggernaut in waiting. Here are the results with the age adjustment:
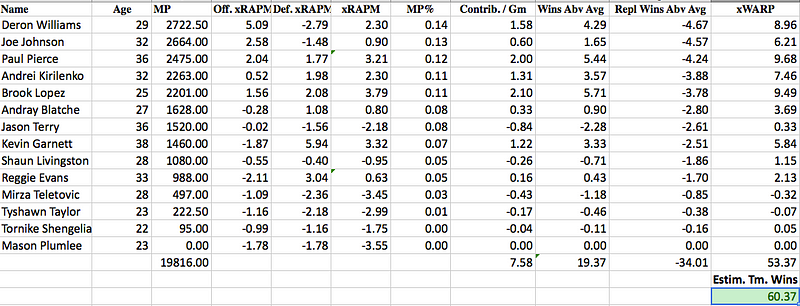
I have seen the Nets compared to this year’s Lakers as a top-heavy team full of oldsters assembled together to take a shot at a title, with the implication being that the Nets will fall apart just as spectacularly as those Lakers did. I think this is wrong because these two teams could not be more different in terms of roster construction. This Nets team is DEEP. Eight of their top 10 players in projected minutes played are positive xRAPM contributors and ALL of the top 10 in projected minutes played are above the replacement level of -2.5 in xRAPM.
By way of contrast, the 2012–13 Lakers gave over 1300 minutes to Earl Clark (-4.14 xRAPM), 1175 minutes to Steve Blake (-3), plus over 1500 minutes combined to Chris Duhon and Darius Morris (-3.95 and -4.93, respectively). Steve Nash was merely above average (+.7) when he played and on top of that, he was hurt often (hence all the minutes for Duhon, Morris, and Blake). This year’s Lakers squad had little depth and suffered significant injuries to key contributors (Pau Gasol, Steve Nash, and Kobe Bryant) and saw Dwight Howard play when he likely should have been recovering from back surgery. Dwight was awesome (+5.54), but he wasn’t as great as he can be (+8.8 in 2011–12, +9.7 in 2010–11). This is not to say that the Nets will necessarily be much healthier at the top than the Lakers were, but it is to say that they are better prepared to handle injuries thanks to their far superior depth.
If these Nets stay reasonably healthy and Jason Kidd is worth a lick as a coach, they represent a significant threat to the Heat, Bulls, and Pacers at the top of the Eastern Conference. They may even be the favorites to win the regular season Eastern Conference crown, under this analysis, if not in Vegas. Speaking of Vegas favorites, the Miami Heat will be next up in this series of posts.
Image from Keith Allison via Flickr
