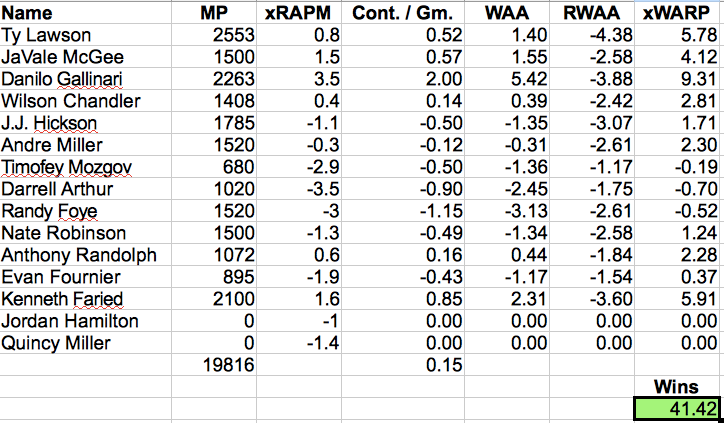
The Denver Nuggets had a no good, very bad offseason. They lost their very talented GM and fired their very good coach. They lost their best wing defender, and arguably their best overall player, to the team that ousted them from the postseason. They lost a couple other helpful players like Kosta Koufos and Corey Brewer. They added a number of players who simply shouldn’t be expected to be very helpful- like Randy Foye, Darell Arthur, and to a lesser extent, J.J. Hickson. How does it all add up?
After adjusting for the league-wide context (subtracting 1.112 from the .15 net rating shown above), the Nuggets total Net Rating is roughly -.96. That translates to a 38 win squad. Given that they have the strongest homecourt advantage in the league and the schedule they actually will play, the Nuggs project to be a 40 win team. Regardless of whether the first or the latter number proves to be more correct, the Nuggets appear to be in line for a staggering fall from their 57 win record of last year. The takeaway is that losing Andre Iguodala, Kosta Koufos, and Corey Brewer and replacing them with much worse players is going to really hurt the Nuggets this year. It should not shock anyone at all to see them fall all the way out of the playoffs. Hopefully for Denver’s fans they have a plan going forward to right the ship that’s seemingly lost its way.
The Toronto Raptors had a great offseason. First, and probably most important for the longterm, they hired Masai Ujiri as their new GM. Ujiri has developed quite a reputation for being one of the league’s finest executives. As is often the case with what seem like great GMs, though, he’s made a lot his hay thus far by duping the New York Knicks into dumb trades.
First, the Knicks gave up a whole host of useful players- Danilo Gallinari, Raymond Felton, Wilson Chandler, and Timofey Mosgov –and a 2014 first round pick all to get Carmelo a few months earlier than they could have gotten him in free agency. That was all our man Masai.
Then, in the Raptors second great move of this summer, in his first few days as the new man at the wheel in T-Dot, Ujiri unloaded Andrea Bargnani’s albatross of a contract and convinced the Knicks to include a first round pick and a couple of second rounders with deadeye shooter Steve Novak and Marcus Camby’s contract, all for the right to be the team that eats the remainder of Bargnani’s turd sandwich of a contract. Gotta hand it to Masai, he knows which teams to call when it’s fleecing time. Usually, that means the Knicks- and Knick fans thought this would end when Isaiah was fired. Ha! What’s the result of all the Raptors maneuvering, according the Walker xRAPM projections and my minutes allocation and context adjustment?
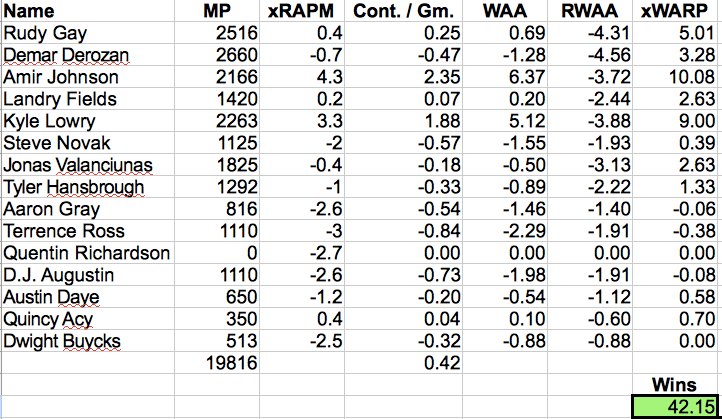
Pretty good, Raps fans. Pretty, pretty good. The Raptors project to be just very slightly better than the new-look Pistons, but they both project to win 39 games- after adjusting the win totals so that they properly sum to 1230 leaguewide or, more accurately, so that total xRAPM sums to 0, as it must by definition. The Raps and Pistons project to finish 7th and 8th, respectively, in the East. Right on their heels should be Cleveland and Washington- though I projected Washington prior to the news of Emeka Okafor’s indefinite absence due to a neck injury, so maybe they’ll be out of the running, as he was one of their stronger expected xRAPM contributors. Looking at the injuries Washington has already suffered and the relatively injury prone Cleveland roster, I’d say that if I had to bet on it things, the Raptors and Pistons seem to be by far the best bets of these 4 teams to snag those last two playoff spots.
How do the Raptors look to get it done? Well, they’ve got a strong starting five lead by the unheralded, but dynamic xRAPM combo of Amir Johnson and Kyle Lowry, who both project to be very, very good players. Rudy Gay projects to be slightly above average, as ever. Jonas Valanciunas projects to improve significantly, getting him close to average level xRAPM, at a very young age — which bodes well for his future. Landry Fields is also around, looking likely to be very average overall and remaining laughably overpaid for that very average play. I hope he’s sending a portion of those checks to a charity of Steve Nash’s choosing. DeMar DeRozan will help and he’ll excite with his flashy play, but he still projects to be a bit below average and he’ll probably never live up to his own rather large contract. It’ll be interesting to see if Masai Ujiri attempts to move either of those last two. Even if Ujiri makes no moves, though, this current Raptors roster has a very good chance at playing games in late April. Rejoice, Raptors fans!
The New Orleans Pelicans were a nice little team this past year- complete with promise, some solid young role players and a neophyte, likely franchise altering big man in the fold. They looked like a team that would add a top 6 selection to pair with their star, Anthony Davis, and later have another likely lottery pick in the much ballyhooed 2014 draft. That would have been one way to go. Many think it was the right way to go. It’s not the way the Pellies (I got you, Zach Lowe!) decided to go, though. Instead, they opted to cash their chips in now and bet on a player in Jrue Holiday who is no doubt talented, but may not be worth the price New Orleans paid to grab him.
The draft rights to Nerlens Noel, whom many observers believed to be the draft’s most talented and promising player, along with their selection in the 2014 draft seems like quite a high price for a very good player who is not in the elite tier of his position. On the other hand, the Pelicans got someone everyone knows is a good player, and there’s some value in that.
In addition, the Pelicans nabbed Tyreke Evans from Sacramento. Evans famously is one of very few players to ever average 20 pts, 5 assists, and 5 rebounds as a rookie. There are all sorts of problems with relying on counting stats per game, but anytime you’ve accomplished something only LeBron James, Michael Jordan, and Oscar Robinson ever did- you’re in good company. The problem for Evans is what came after all that promise in his first season. He was, basically, worse the next two years, before finally reaching roughly the same level of performance as his rookie year, last year. The Pelicans are betting that he’s finally got things figured out and he’s set to take off in new surroundings. If he does, his roughly $11 million annual salary will seem like a bargain on a similar level to that of Celtics point man Rajon Rondo and maybe to a lesser extent, Stephen Curry’s absolute steal of a deal. In order for Evans to reach that point, though, he will have to keep up or surpass his offensive contributions of the past and improve significantly from his, frankly, below-average to bad defense.
There’s hope for these Pellies, though, to play in the playoffs. I have them projected as the ninth best team in the West for next year, but the playoff bubble is also subject to the vagaries of injuries, luck, and teams and / or players surprisingly outperforming their expected level of performance. This is a squad that could easily squeak into next year’s playoffs out West. So how do the projections say they will likely get there?
Note: These numbers have to be adjusted for the context of the entire league average, which projected to be roughly +1.11 per team. That’s impossible; average must xRAPM leaguewide must, by definition, sum to 0, so adjusting the Pelicans down to -.69 from their previously unadjusted expected point differential of .42, we get a team expected to win roughly 39 games. That’s about as bubbly as bubbly gets for playoff hopes.
According to Nathan Walker’s numbers Pelicans look to get things done with a team deep with slightly to nicely above average players in the starting lineup, lead by Davis, Ryan Anderson, and Holiday. Tyreke Evans also projects to be above average but not as far above it as you’d like from a guy making the salary he’s slated to make and certainly not as much as those gaudy counting stats from his rookie year would suggest is his potential impact.
The Pelicans also need a relatively healthy year from Eric Gordon, which they project to get here. Gordon’s no world-beater but he’s above average, which is much more than can be said for the sub-replacement contributors behind him in the guard rotation- Austin Rivers and Anthony Morrow. If New Orleans is to really compete for that bottom rung of the playoff ladder, a healthy Gordon is probably a necessity. Here’s hoping he can finally stay on the floor and show more of the talent that made him the centerpiece of the Chris Paul trade for New Orleans.
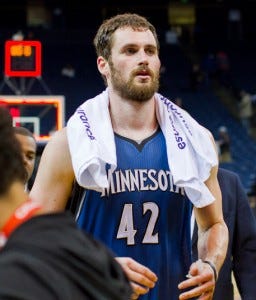
The Minnesota Timberwolves haven’t made the playoffs in nine seasons. They’ve likely had the talent to make it over the last two years, but bad luck with injuries to their two most important players, Kevin Love and Ricky Rubio, have, unfortunately, blown those hopes to hell. Love and Rubio have combined to play just 171 games of 296 games the two of them, together, could have possibly played over the last twoyears. Next year, as it always does, provides another opportunity for the ‘Wolves to crack the playoffs for the first time in ten seasons. What do the numbers suggest Minnesota fans can likely expect?
This ‘Wolves squad has 45 win talent, without context. On the other hand, the numbers, as I ran them initially, gave each team, on average, 1.11 points over the required sum of 0 total net points across the league- given that basketball is a zero sum game. Every player making a positive contribution comes, in +/- and thus xRAPM, at the expense of another player or set of players being debited for those positive contributions coming against them. As a result, you can adjust the strength of each team simply by subtracting out those 1.12 points from their total Contribution per Game. When it doing this with the Timberwolves, it makes them a +.31 team. Plugging in to the simple MOV to wins equation (2.7*MOV+41 = Wins), the Timberwolves project as a 42 win team. This jives with their projection in the big schedule spreadsheet, as a 42 win team, when factoring in their strength, the strength of their opponents, and their home court advantage.
How does Minnesota get there? Kevin Love and Ricky Rubio carry most of the weight, as any even casual Timberwolves observer would expect. Their health is, obviously, of paramount importance for the ‘Wolves to reach their postseason goal. Nikola Pekovic, Kevin Martin, Chase Budinger, Corey Brewer, and Derrick Williams are the lesser lights ranging from slightly above average to slightly below, though, they’re all solidly above replacement and so they should all be helping. Also of note, Shabazz Muhammad projects to be pretty okay as a rookie, by the Hickory High rookie projections, and as a result, he’s an above replacement contributor by these numbers.
For my part, I’ll be rooting for the ‘Wolves. Their fans have dealt with the disappointment of David Kahn’s draft record, the tantalizing frustration of waiting for Ricky Rubio to come over from Spain, and the scuttling of the last two promising seasons due to Love’s recurring injuries and Rubio’s torn ACL. The players, Love especially, must be just as frustrated, if not more so. This is a team that, health permitting, should compete for the right to test themselves against the Thunder or the Rockets or the Clippers in the first round of next seasons’ playoffs. Hopefully the Timberwolves will finally be playing come late April.
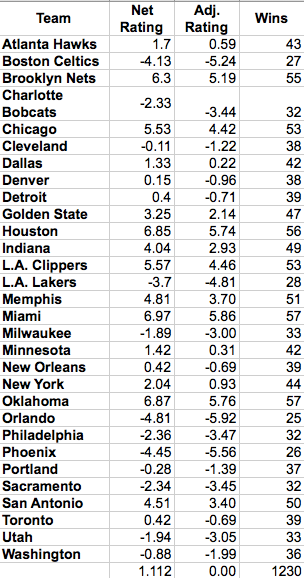
I mentioned before that my initial run through of the projected wins for each team overestimated wins, due to the xRAPM projections combined with my minutes projections projecting league average xRAPM to be +1.11 per game, which is impossible. The average total xRAPM per team across the league must, by definition, equal zero. Any team’s positive xRAPM- because it is a plus-minus statistic- comes at the expense of its opponents’ xRAPM, so across the 30 teams, things must sum to 0. In order to account for this, I adjusted the net rating of each team to reflect the +1.11 initial average and reset the league average to 0. This also results in team wins summing properly to the 1230 available in any given year. Below is a chart with the adjusted net ratings and win totals. After that, those win totals are placed into the context of each conference, so you can see which teams project to be in the playoffs.
I think these results pass the smell test, with the notable exception of Philadelphia inexplicably projecting to win 32 games. Let me know what you think. I’ll be continuing to post team breakdowns, with the unadjusted numbers (all of my graphics showing the numbers are already done and it would be a pain to redo them all), though I’ll be sure to make note of the need to adjust the numbers to account for the +1.11 average in those future posts.
The Dallas Mavericks missed the playoffs for the first time in a dozen years last year. Last year’s roster was constructed using something of a holding pattern while the Mavs waited for the big fish in the 2012–13 free agent class, namely Dwight Howard and, to a lesser extent, Chris Paul. Team owner Mark Cuban loaded the roster with 1 year contracts for players with whom the team was more than willing to part, which is just what they did at the start of free agency. Unfortunately for the Mavericks, Chris Paul stayed home in Los Angeles and Dwight Howard took his act, along with his considerable talents, to Houston. At that point, the Mavericks had a choice between another year of 1 year contracts and pursuing a marquee free agent in the 2014 class- the year a certain guy wearing #6 in Miami hits the open market, again- or signing the best players with whom they could fill their roster.
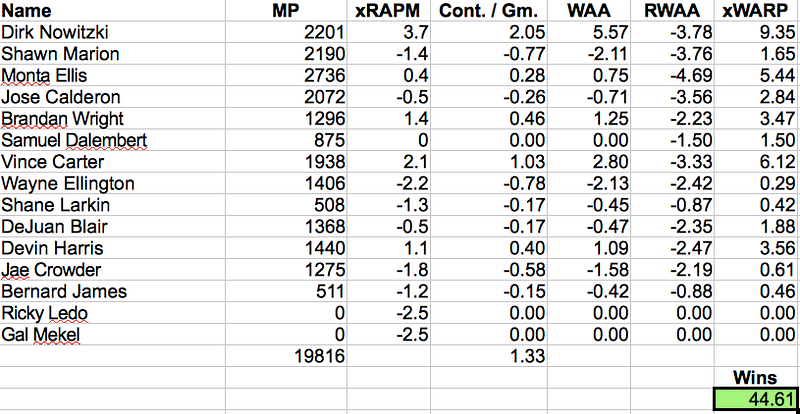
After asking the face of the franchise, Dirk Nowitzki, for his patience for one year, the Mavericks opted not to ask him for further patience as he reaches the twilight of his career. Good for the Mavericks. They’ve built a team that should compete for one of the West’s final two playoff slots and Dirk Nowitzki deserves to be playing meaningful basketball come late April 2014. Plus, Nowitzki is good enough, even at this late stage of his career, that with a little bit of help he’s capable of carrying a team to a playoff series win. Good on Dallas management and owner Mark Cuban for giving him the chance to do just that. So just how much help has Dirk been given and what, exactly, do the numbers say we should roughly expect?
The Mavericks have the talent of a 45 win team, roughly. After plugging their projected relative strength in versus their opponents’ and accounting for home court advantage, my big spreadsheet predicted them to win 42 games, on average. The Western Conference, man. Most of the Mavs’ projected contributions come, unsurprisingly, from Dirk. Mavs management, though, has done an incredible job of getting players who project to be at least at or above replacement level. There are no other stars paired with Dirk, but this is a deep team with two very helpful scoring wings- Vince Carter and the, somewhat unfairly, much maligned Monta Ellis- surrounding the big German. They also added a point guard, in Calderon, who can actually get Dirk the ball in his favorite spots and knock down the open looks Dirk creates, unlike last year’s hot mess at the lead guard spot.
It’s a roster that fits together well; so well, in fact, that given head coach Rick Carlisle’s usual brilliance, this squad could easily out perform that 45 win talent. The Chicago Bulls have made a habit these last few years out of pairing teams that fit well with a brilliant coach to outperform the talent of the squad. I wouldn’t be shocked to see these Mavs run a similar formula, only instead of dominating on defense like the Bulls, this Dallas squad could put together some truly elite offensive stuff, provided Carlisle can rein in Monta Ellis’s worst instincts- a burning desire to shoot off-balance, off-the-dribble 20-footers, mostly.
I’ve addressed the biggest problem with the xWARP projections by doing my exhaustive look at each team’s schedule using probability to project an expected number of wins. As a result, all of the projected wins data is already out there for you to look through, but I enjoy writing about each team and, I think, people like to read these looks at each team through Nathan Walker’s projected xRAPM. Plus, in writing about each team’s makeup, it’ll be more apparent how I arrived at the relative predicted strength of each team. This was represented as “Net Rating” in the big spreadsheet, but on the team posts, its the summation of Contribution per Game (“Cont. / Gm.” in the charts). I still think this is a useful exercise, so I’m going to continue doing it. Today, I’ll be taking a look at a team many people have pegged for an Eastern Conference playoff spot, the Washington Wizards.
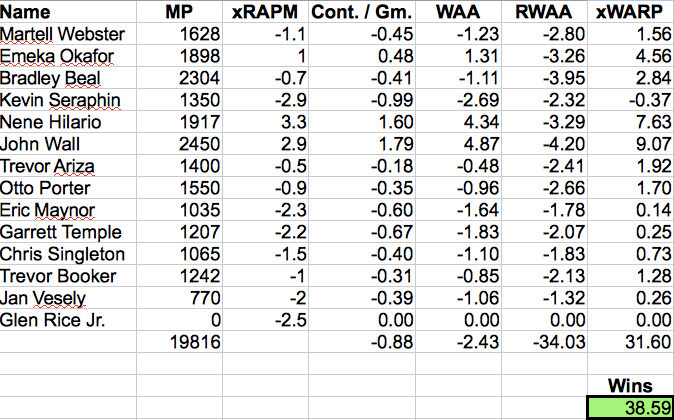
The Wizards look pretty much as expected, at first blush. They’ve got a Net Rating or Total Cont. / Gm. of -.88 which makes them roughly a 39 win team, all else equal. All else is, however, not equal. It never is in the NBA. Strength of schedule does matter somewhat, especially for teams on the cusp of a playoff spot. The Wizards projected win total using the log5 method with the net ratings of their opponents projects them to win only 37 games. 2 wins may not seem like a lot, but, again, it matters a great deal for teams jockeying for those final couple playoff spots in each Conference.
John Wall projects to be quite good, by the projected xRAPM numbers, basically repeating his performance from last year, only with more minutes played. If Wall can actually make a leap ahead of his performance last year, the Wizards will more firmly entrench themselves as a playoff team. Two of Washington’s more important players, Nene and Emeka Okafor, both project to either regress and/or decline, with Nene having the bigger expected dropoff. These declines somewhat offset the expected increase in minutes for Wall, and here we are. The Wizards may find themselves on the outside looking in on the playoffs, again.
Subjectively, my initial thought was that Bradley Beal will prove to be much better than his projected xRAPM suggests, and with Wall’s potential for improvement, this 37 win projection may prove much too low. Beal is so young and the talent is so clearly there that it’s hard to believe he won’t be a better than league average player next year by xRAPM. On the other hand, Beal’s xRAPM last year was -2.0, owing mostly to subpar defense, so a -.7 total xRAPM would represent a pretty large improvement, on its own. Maybe Nathan Walker’s on to something with his numbers. In any event, the statistical projection game is fraught with caveats galore, so as always, take these pieces for what they are: a fun exercise in educated guessing at what next year’s season holds.
Following up on my last post, I decided to leap ahead a bit and use the projected season level team point differentials and home court advantage numbers from Evan Zamir — which show that not all home court advantages are made equal — in order to predict the probabilities of a team winning each game on its schedule, based on the strength of the opponent and whether the game was home or away. The above spreadsheet is the result of all that work. The column marked “Log5 W%” represents the probability a team will win a given game, using the log5 method. The column marked “Pyth W%” is the same, only using the projected point differential-marked “Game MOV” in the spreadsheet- in order to use the Pythagorean formula to determine the probability of a win in that game.
Caveats, of course, abound. The minutes projections that I made could be wrong, skewing the projected strength of each team. The xRAPM projections from Nathan Walker and the rookie projections from Hickory High will be imperfect- they are just projections, afterall. In addition, teams may play better or worse for a stretch than their season level strength might indicate- for example, the Lakers will likely be much worse in the early part of their schedule when they are likely to be without Kobe, despite all of his tireless work to get back in time for the start of the season. Kobe is Kobe, but Kobe is also human and a torn achilles is one of the toughest injuries from which to return that exists. So take these numbers with the large dose of salt that they deserve. But, you know, have fun with them.
Sidenote: the Sixers will almost certainly not win 33 games or anywhere close to that many- I’m not sure what to do about that. The issue, I think, is that xRAPM basically measures impact on the court- but within the role that the player played- and can’t really account for changing roles. A lot of players on Philadelphia’s roster are going to be thrust into roles for which they are simply ill-equipped, whether due to inexperience or lack of talent, and therefore, I’d be shocked if you saw them perform at the level they are projected to perform by the numbers. This includes their new rookies, Nerlens Noel and Michael Carter Williams, who both project to be solid rookies, according to the Hickory High regression. Those projections are based on a regression of past performers and I think it’s pretty fair to say that the average rookie in the time frame during which the regression covered simply did not have anywhere near the level of free reign- and therefore on-court responsibility — that Noel and MCW will have this coming season.
In calculating the xWARP projections I’ve been doing, I noticed a worrying problem. The total number of wins projected for each team appeared to be roughly 7% too high. There are only 1230 games, and thus, 1230 wins available for the 30 teams in the NBA to win. In doing my xWARP projections, I had just been posting the win totals as I did each team.
Last night, I finally got around to running the numbers on all of the remaining teams I’d yet to post and summed up team wins for the whole league. Unfortunately, total team wins summed to roughly 1318 wins, which is obviously way too many. There are a number of ways to deal with this problem. The lazy, easy way would be to simply multiply the win totals of each team by 1230/1318 or roughly .933. The top teams then have 55 projected wins and the bottom dwellers would be in the mid to high 20s in wins. This solves the problem, but it doesn’t seem that consistent with reality, so I’ve decided to go another way.
I’ve hinted at wanting to do this before, but my current plan is to go through each and every game on the schedule and utilizing the projected MOV for each team (in the spreadsheets it’s the total Contribution / Game) plus Evan Zamir’s ridge regression work on homecourt advantage, I plan to figure out the win probabilities of each of the 1230 regular season games and then use those probabilities to determine total team win totals. I will then post the updated results. I will be updating the posts that already exist to reflect changes in team win totals after this is all done, and I will also do a master post with the full league projections.
I’m bummed out that the math didn’t work out as well as I’d hoped, but I’m excited to go through the schedule in such detail. The other good thing is that doing things this way acts as a built in strength of schedule adjustment for teams with more or less difficult schedules. Thanks for reading and for your patience while I work out the kinks of all this.
The Cavs had a very interesting offseason. They surprised many when they used their first overall pick on Canadian forward Anthony Bennett. After that, they made a couple of interesting signings. First, they made a priority of snagging veteran combo guard, and sixth man of the year candidate last year, Jarrett Jack. Later, they grabbed swingman Earl Clark from the Lakers, for reasons that remain unclear, save for the possibility that Mike Brown just liked Earl Clark a whole lot in the five games he got to coach him in Los Angeles, though you certainly wouldn’t guess that judging by the number of minutes Brown played Clark. Whatever the reason for the deal, Earl Clark is just not very good at NBA level basketball, so the Cavs signing him for 2 years, $9 million doesn’t make much sense. It’s not a killer deal, in that it has very little effect on the Cavs cap sheet going forward, but there had to be better options to give $4.5 million per annum than Earl Clark. After that strange signing, Cleveland made a very calculated bet on Andrew Bynum’s balky knees, due to his game-tilting impact when he’s able to remain on the floor. I’ve argued before that it was a smart bet. Let’s see how the Cavs project for next year after their offseason moves.
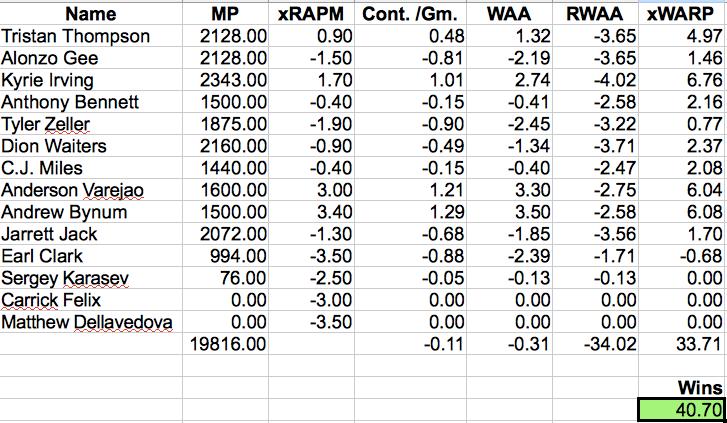
At 41 projected wins, the Cavs look to be firmly within the playoff picture in the Eastern Conference. One thing to consider, though, is that these projections are schedule independent, thus far, and therefore, don’t account for the fact that the Cavs will be playing in the very strong Eastern Conference Central Division. The Central features legitimate contenders in the Pacers and Bulls, along with three other teams, including Cleveland, who should all be in the mix for a spot at the bottom of the Eastern conference playoffs. As a result, things might prove a bit more difficult for Cleveland than, say, the Wizards, who really only have the Heat and Hawks to worry about within their division, with what should be easier games against the lowly Bobcats and the rebuilding Magic. In a tight playoff race, those few easy games could be difference makers.
The Cavs signing of Bynum, based on this projection, looks very solid, as in 1500 minutes, he projects to produce 6.08 wins above replacement by xRAPM (xWARP). Nathan Walker’s projection for Bynum’s xRAPM performance is +3.4, which represents a relatively gentle drop off from his +3.9 in his last season (2011–12). That number may prove too optimistic, but I don’t think it’s totally unrealistic either.
One more thing of note with respect to this Cavs team. Their “best” player by conventional wisdom and the eye test is decidedly not their best player when viewing things through the xRAPM lens. Kyrie Irving is a good player by xRAPM, but he is not the superstar he is labeled by other metrics. This is basically entirely because of his defensive performance, which is, to put it nicely, very poor. Last year, Kyrie was a +2.96 on offense, while giving most of it back by putting up a very bad -2.04 on defense, for an overall xRAPM of +.92. On the bright side, many point guards struggle with defense and then improve as they gain experience and learn their responsibilities. Kyrie projects to improve in overall xRAPM to +1.7 and even that may be underestimating things if Mike Brown can impart all of the defensive expertise inside that head of his.
Dan Gilbert stated at the draft lottery that he wanted to avoid another trip to that most hopeful and depressing night on the NBA calendar, and it appears his front office has done enough to get the job done — provided Andrew Bynum, Andy Varejao, and Kyrie Irving stay reasonably healthy, admittedly a dodgy proposition.