Projected Wins Adjusted to Match the NBA’s Zero Sum Reality

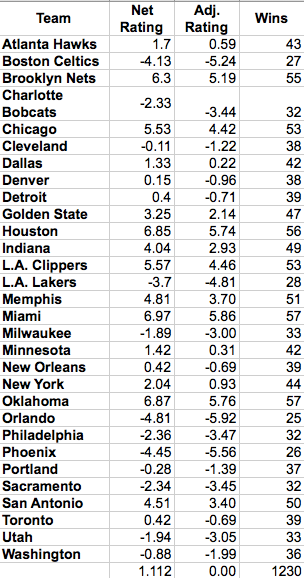
I mentioned before that my initial run through of the projected wins for each team overestimated wins, due to the xRAPM projections combined with my minutes projections projecting league average xRAPM to be +1.11 per game, which is impossible. The average total xRAPM per team across the league must, by definition, equal zero. Any team’s positive xRAPM- because it is a plus-minus statistic- comes at the expense of its opponents’ xRAPM, so across the 30 teams, things must sum to 0. In order to account for this, I adjusted the net rating of each team to reflect the +1.11 initial average and reset the league average to 0. This also results in team wins summing properly to the 1230 available in any given year. Below is a chart with the adjusted net ratings and win totals. After that, those win totals are placed into the context of each conference, so you can see which teams project to be in the playoffs.

Projected Eastern Conference Standings

1. Miami — 57–25

2. Brooklyn — 55–27

3. Chicago — 53–29

4. Indiana — 49–33

5. New York — 44–38

6. Atlanta — 43–39

7. Toronto — 39–43

8. Detroit — 39–43

— — — — — — — — — — — — — — — — — — — — — — — — — — —

9. Cleveland — 38–44

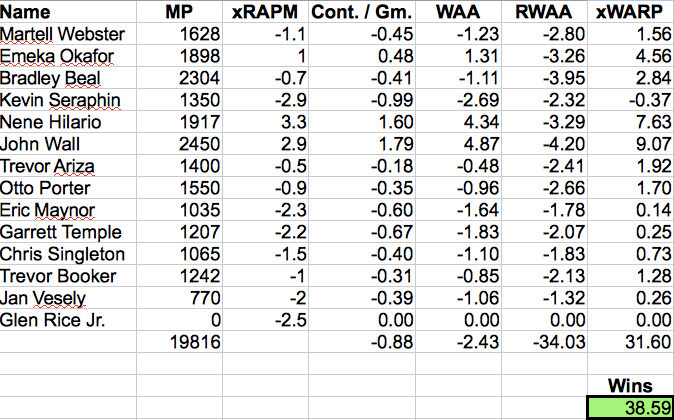
10. Washington — 36–46

11. Milwaukee — 33–49

12. Philadelphia — 32–50

13. Charlotte — 32–50

14. Boston — 27–55

15. Orlando — 25–57

__________________________________

Projected Western Conference Standings

1. Oklahoma City — 57–25

2. Houston — 56–26

3. Los Angeles Clippers — 53–29

4. Memphis — 51–31

5. Spurs — 50–32

6. Golden State — 47–35

7. Minnesota — 42–40

8. Dallas — 42–40

— — — — — — — — — — — — — — — — — — — — — — — — — — —

9. New Orleans — 39–43

10. Denver — 38–44

11. Portland — 37–45

12. Utah — 33–49

13. Sacramento — 32–50

14. Los Angeles Lakers — 28–54

15. Phoenix — 26–56

__________________________________

I think these results pass the smell test, with the notable exception of Philadelphia inexplicably projecting to win 32 games. Let me know what you think. I’ll be continuing to post team breakdowns, with the unadjusted numbers (all of my graphics showing the numbers are already done and it would be a pain to redo them all), though I’ll be sure to make note of the need to adjust the numbers to account for the +1.11 average in those future posts.

Image from Keith Allison via Flickr.

Projecting the NBA using xWARP: Washington Wizards

I’ve addressed the biggest problem with the xWARP projections by doing my exhaustive look at each team’s schedule using probability to project an expected number of wins. As a result, all of the projected wins data is already out there for you to look through, but I enjoy writing about each team and, I think, people like to read these looks at each team through Nathan Walker’s projected xRAPM. Plus, in writing about each team’s makeup, it’ll be more apparent how I arrived at the relative predicted strength of each team. This was represented as “Net Rating” in the big spreadsheet, but on the team posts, its the summation of Contribution per Game (“Cont. / Gm.” in the charts). I still think this is a useful exercise, so I’m going to continue doing it. Today, I’ll be taking a look at a team many people have pegged for an Eastern Conference playoff spot, the Washington Wizards.

The Wizards look pretty much as expected, at first blush. They’ve got a Net Rating or Total Cont. / Gm. of -.88 which makes them roughly a 39 win team, all else equal. All else is, however, not equal. It never is in the NBA. Strength of schedule does matter somewhat, especially for teams on the cusp of a playoff spot. The Wizards projected win total using the log5 method with the net ratings of their opponents projects them to win only 37 games. 2 wins may not seem like a lot, but, again, it matters a great deal for teams jockeying for those final couple playoff spots in each Conference.

John Wall projects to be quite good, by the projected xRAPM numbers, basically repeating his performance from last year, only with more minutes played. If Wall can actually make a leap ahead of his performance last year, the Wizards will more firmly entrench themselves as a playoff team. Two of Washington’s more important players, Nene and Emeka Okafor, both project to either regress and/or decline, with Nene having the bigger expected dropoff. These declines somewhat offset the expected increase in minutes for Wall, and here we are. The Wizards may find themselves on the outside looking in on the playoffs, again.

Subjectively, my initial thought was that Bradley Beal will prove to be much better than his projected xRAPM suggests, and with Wall’s potential for improvement, this 37 win projection may prove much too low. Beal is so young and the talent is so clearly there that it’s hard to believe he won’t be a better than league average player next year by xRAPM. On the other hand, Beal’s xRAPM last year was -2.0, owing mostly to subpar defense, so a -.7 total xRAPM would represent a pretty large improvement, on its own. Maybe Nathan Walker’s on to something with his numbers. In any event, the statistical projection game is fraught with caveats galore, so as always, take these pieces for what they are: a fun exercise in educated guessing at what next year’s season holds.

Image from Keith Allison via Flickr