Most, if not all, NBA draft discussion, whether from major outlets, independent creators dreaming of a front office job, or people just yapping on X or Bluesky, suffers from large flaws rooted in human cognition.
Here are a few of those flaws and the specific biases that drive them.
Player Comparisons (Statistical and Athletic)
People (me included!) love player comparisons. I love to look at them and use them to shape my thinking. Most draft analysts include them in their coverage because they offer a nice shortcut to what feels like understanding. When you’re trying to convey information about anywhere from 30 to 100 players to an audience, it makes sense that you have to cut some corners. Unfortunately, player comparisons heavily bias anyone trying to accurately project prospects due to anchoring bias and availability bias.
Anchoring bias causes us to rely too heavily on the first piece of information we receive about a topic. If the first thing you hear about Cameron Boozer is that he’s like Kevin Love, you are going to be heavily anchored to that as your perception of what sort of player he is and how good he can be.
Part of why player comparisons are so popular is also the exact reason they distort our evaluation. Availability bias is a mental shortcut where you overestimate the likelihood of an outcome based on how easily comparable examples come to mind. If you are anchored to a specific comparison, you will likely overestimate the probability that a prospect turns out exactly like that player simply because it is easy to visualize. Being able to easily picture an outcome is satisfying, which often leads us to dig in further on our initial assessment.
Essentially, player comparisons artificially narrow the aperture for a player’s range of outcomes, leading us to pigeonhole prospects without fully considering their true upside or downside.
Overestimating Our Understanding of Whether “That Will Work in the League”
Seemingly every draft season, players who dominated high-level competition, whether high-major college ball or professionally overseas, face skepticism about whether their style of play will translate to the NBA. Yet, consistently, the players who face these questions outperform prospects with elite athletic tools who produced far less prior to arriving in the NBA. The number one predictor of NBA success is prior success at lower levels of competition, adjusted for age and the strength of that competition.
A big driver of these misevaluations is, once again, availability bias. We only have examples of what is working in the league right now to project forward from, but any look back at basketball history shows that the very best players consistently change how the league works.
When LeBron James (a 1st overall pick) was the best player in the world, everyone was obsessed with wing play as the only way to build a team. Then Steph Curry (the 7th overall pick: labeled too skinny, lacking athletic pop, out of Davidson) arrived, and everyone became obsessed with three-point shooting and small-ball. Later, Giannis Antetokounmpo (the 15th pick, who entered the league incredibly skinny and raw after playing competition so poor it was hard to gauge his talent) and Nikola Jokic (the 41st pick, deemed overweight and unable to jump) took over the league. Those two giants and Joel Embiid (the 3rd overall pick) won MVPs. They’ve been followed by Victor Wembanyama (the 1st pick), so we see big men rule the league again. Even with that shift, parity has risen, and we’ve seen titles and MVP-caliber production come from a wiry, strong, shotmaking savant like Shai Gilgeous-Alexander (the 11th pick) and a six-foot-flat brick of a man who can’t jump at all in Jalen Brunson (the 33rd pick).
The point is that there is no single path to greatness. Despite the immense diversity of talent and paths to superstardom that have already proven viable, a ton of perceived certainty remains around which playing styles or athletic profiles can translate to the NBA. This is a mistake. The common denominator among all the players listed above is that they completely dominated whatever level of competition they faced. You can find a bit more certainty in translation the better the competition they played against, but that’s really about it.
To continue the example from the previous section: betting against Cameron Boozer because of minor athletic flaws, like heavy feet or a lack of elite verticality, is poorly reasoned. It ignores the fact that he has absolutely dominated every level of basketball he’s ever played, including being the clear best player in college at just 18 years old.
Reliance on Archetypes and Roles as Heuristics
A very close cousin of the player comparison is the habit of fitting prospects into specific archetypes and roles to quickly convey information. While this serves a highly useful purpose for an audience, it must be used judiciously because it is highly likely to influence the thinking of the evaluator as well. This creates a trap for analysts putting together boards; once again, it narrows the aperture for a player’s range of outcomes and assumes a level of certainty in development that is generally unwarranted.
Because Jalen Brunson is small and unathletic, his archetype and league slotting were pre-determined to be a “bench scorer.” It’s why he fell to the second round, despite a high school and college resume that consistently showed him to be an elite basketball player. Many teams missed out on an on-ball star because of a misapplication of the archetype heuristic.
Similarly, Stephen Curry had the ball constantly at Davidson, making his archetype an on-ball guard. To many, however, he didn’t seem to have the frame to hold up to heavy NBA usage. He turned out to be the greatest shooter of all time, paired with a coach who figured out how to leverage his shooting gravity to create open looks through relentless ball and man movement. (He also got a lot stronger because he is a competitive nut.) Steph’s draft-night archetype as an on-ball guard who might be too thin to carry a full-time workload caused him to slip behind lesser talents. He and Steve Kerr created an entirely new paradigm to unlock his dominance.
The best way to project whether a guy will find a way, or create a brand new archetype, to dominate in the NBA is if he found a way to dominate before getting there. Not every dominant non-NBA pro or college player will successfully transition. In fact, most will fail because it is the best basketball league in the world. Conversely, not every dominant NBA player was a dominant amateur: Anthony Edwards was fairly middling at Georgia, for instance. The vast majority of dominant NBA players, however, were absolutely dominant pre-NBA.
Those are three of the primary errors or flaws I see in most draft discussion. There are others, but this is probably long enough for now. I may return to this with a part 2, but maybe not, dude.
Everyone knows the Bulls are really, really far from being Good. They have one of the worst situations in the league when it comes to young or in prime talent on the roster. It was due to this lack of promise for the future and talent in the present, among many other reasons, that Chicago’s former front office were relieved of their duties earlier this month.
I was curious just how far off the Bulls are, though, because it might be useful for setting realistic expectations for what the next lead decision-maker in the Second City can reasonably be expected to pull off and on what timetable. It might also provide us some insight into how the franchise should proceed moving forward.
A quick and dirty analysis should suffice for this exercise. To come up with a rough sense of what the Bulls should be aiming for roster-wise, I decided to look into the rough talent levels for teams in the top 4 of opponent-adjusted Net Rating at basketball-reference from 2018-19 through 2024-25. Almost every title winner since the end of the Dynasty Warriors (and the beginning of the NBA’s Parity Era), has been in the top 4 of this pace-adjusted, opponent-adjusted view of team strength, with the lone exception being the 2023 Denver Nuggets. They were 7th, though the gap between them and the 4th place team was just .55 points per 100 possessions. I picked the top 4 teams, because all else equal, they should represent an approximation of which teams are Conference Finals Worthy, which feels like as good a definition for Contending Team as there is to me.
In order to get a sense for the average talent level of those Top 4 Teams, I used tiers based on BPM (excluding any player with less than 500 minutes) and bucketed players into the following buckets:
Top 5
Top 6-10
Top 11-24
Top 25-50
Top 51-100
Top 101-150
Other
The results were as follows:
BPM Bucket | Players
Top 5 | 0.3
Top 6-10 | 0.2
Top 11-25 | 1.3
Top 26-50 | 1.7
Top 51-100 | 2.4
Top 101-150 | 2.0
This suggests that to be a Contender in the NBA, you need roughly 8 “plus” players in your rotation (Top 150 BPM cut off translates to roughly +0.0). You want that distributed so that you have at least 2 Top 25 players, 2 players in the Top 26-50 bucket, 2 players in the Top 51-100 bucket, and 2 players in the Top 101-150 bucket. That’s a lot of good players and, obviously, more is better. This is roughly what a target should look like, but if you can do better, clearly, you should. What do those buckets translate to in BPM values?
The average cutoffs over the last 8 seasons (2018-19 through 2024-25) for these buckets are as follows:
BPM Bucket  | Avg BPM Cutoff
Top 5       | 7.9
Top 6-10    | 6.2
Top 11-25   | 3.9
Top 26-50   | 2.6
Top 51-100  | 0.9
Top 101-150 | 0.0
So, where do the Bulls stand today with the players on their roster going into 2026-27?
Josh Giddey finished this past season with a +2.7 BPM, which would put him in the Top 26-50 bucket. Tre Jones landed at a +1.3 BPM, which puts him the Top 51-100 bucket. The Bulls do not have a single other player rostered for next year that qualifies as a Top 150 player currently, as measured by BPM.
You can quibble with the use of BPM here and suggest that, maybe, Jalen Smith and his on-off-metric dominance should be on this list. I wouldn’t fight you on it, but even if you suggest that, that’s only 3 top 150 players, when you need EIGHT to be a real contender and you can’t just grab 8 guys in the Top 50 to 150 range and pray (which seemed to be Arturas Karnisovas’s plan), because you need a distribution of high end talent, elite role guys, and then additional depth in the rotation out to eight players.
Also troubling for the Bulls is that 2 of their (arguably) top 150 guys on the roster are smack in the middle of their primes. Tre Jones was 26 this year and Jalen Smith was 25. Both are on cheapo deals and could clearly (as this exercise demonstrates) help a team with real aspirations now. As a result, the Bulls’ next decision-maker should look hard at selling Jones and Smith for value, because the Bulls are too far away from being a contending team to be able to take advantage of Smith and Jones’s goodness and cheapness, so spinning that value forward through the acquisition of draft capital makes the most sense for the long-term health of the franchise.
Such moves would leave Bulls with only one Top 150 player on the whole roster: Josh Giddey. Giddey will be 24 next season and is on a decent contract. He could be part of the next Bulls contender, in theory, given his youth and current goodness. Giddey’s unique play-style, strengths and weaknesses, and poor defense make him a dubious fit with better players, however, so even he might not be worth keeping. I am fine with keeping him for the time being, until the Bulls have a better sense of who their next franchise pillar will be.
You might be thinking, what about Matas Buzelis? He put up a -1.0 BPM this past season and more advanced metrics weren’t much kinder. Buzelis is, however, very young. Creator of BPM, Daniel Myers provided an aging curve for BPM years ago and looking at that we can see that Buzelis is likely to peak in his age 27 season. If he follows the curve (i.e. isn’t a developmental outlier), he should peak around a +2.1 BPM, which would put him in the Top 51 – 100 bucket. Certainly a good player, but not one you should necessarily view as a franchise cornerstone. Giddey, for his part, should peak near the end of his current contract, at age 27, as roughly a +4.0 BPM (Top 11-25) player. My evaluation of Giddey’s likely peak is much less sanguine than the Top 25 player BPM suggests, due to fit issues and BPM not capturing defensive impact that well.
Leonard Miller is another young piece who seems like he could crack the top 150 players in the league someday. Other than that, the Bulls have the dice roll of Noa Essengue, their 2025 lottery pick, who barely played before a shoulder injury sidelined him for the year. If both of those guys hit as a rotation level players on a Contender, the Bulls would be up to 4 of the needed 8 Top 150 players, with 0 (zero) Top 10 players.
So what does this suggest, strategically, as the best path forward?
All of the players that matter (Giddey, Buzelis) on the roster are young enough that the Bulls are at least a few years from their peaks. The Bulls have a grip of cap space this summer and 2 top 15 first round picks in the heralded 2026 NBA draft. Given their lack of young talent and the relative youth of the promising players they do have, the Bulls should be patient.
Utilizing their cap space to take on bad contracts to acquire draft assets to get more bites at the apple to get truly game changing talents in the draft is the most sound and logical path forward. The Bulls should absolutely not skip steps here. In addition, given the lack of high upside talent on the roster, their draft strategy should be to swing on the highest ceiling prospects available at their given draft slots (likely 9th and 15th). No drafting 24 year old Yaxel Landebourg, please.
There will be a strong temptation to try to rebuild this thing on the fly, given how directionless and bad the Bulls have been for the last decade since the Jimmy Butler Trade. Hopefully this exercise lays out why that would be a mistake. Building a Contending roster on the fly in a single offseason is extremely unlikely when your cupboard is as bare as Chicago’s is currently. Slow and steady should be their mantra.
Why the Bulls can’t run back next year with Coby White as the starting point guard
In the second season of the wildly popular and oft-memed Netflix show, I Think You Should Leave, there is a sketch where Sam Richardson plays a bizarre emcee for an even more bizarre form of entertainment at a corporate meeting. Richardson parades in a collection of Little Buff Boys, pre-teen boys in “goose suits” flexing their “buff little bodies” for a kayfabe competition. The corporate boss is corralled by Richardson’s emcee character into being the judge of the competition. Against his wishes and better judgement, the Boss makes a tossed-off choice that Troll Boy should be the winner, to which Richardson’s emcee says, “Nah, no. Not Troll Boy. It’s not gonna be Troll Boy. We’re not doing Troll Boy. I mean you get that, right, Troll Boy? You get why it can’t be you? Yeah. Okay, see? It can’t be him. Just can’t be Troll Boy.”
I couldn’t help but think of this sketch when I read today from the Sun Times’ Joe Cowley that the Bulls are “all in” on matching any Coby White restricted free agent offer and “White showed enough for the organization to believe in him taking the starting reins.”
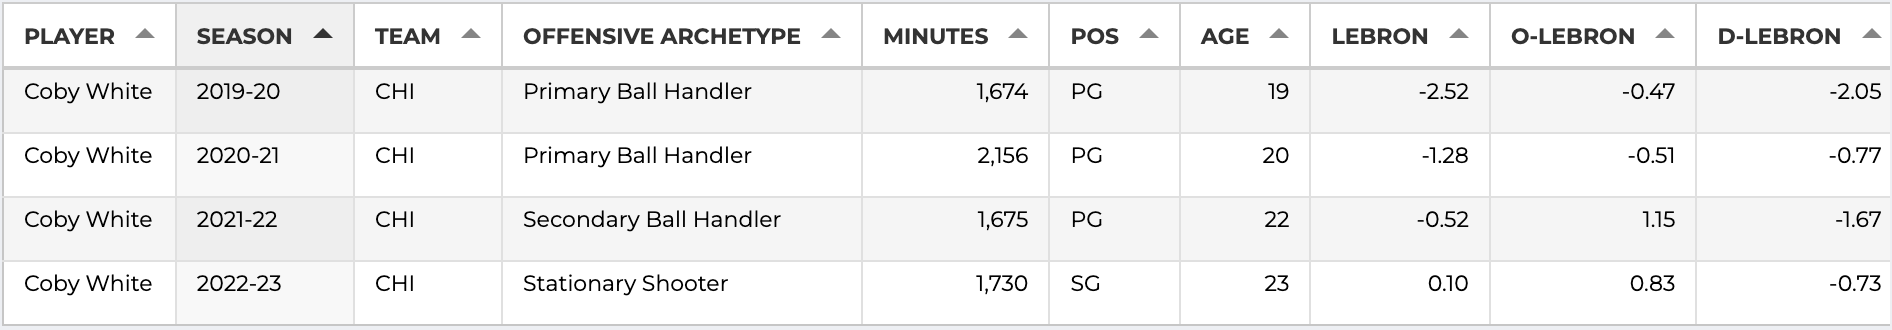
Let me start by saying that I really like Coby White. In fact, I think the Bulls absolutely should bring Coby back this summer as a restricted free agent, because he is a good young player on a team with not enough of them. In addition, he plays an entertaining brand of basketball, appears to be beloved by his teammates, and he did improve in a fairly major way this season. To look at just one publicly available All-In-One metric, Bball-Index’s LEBRON, you can clearly see that this was Coby’s best season of his career and the first year that he was a positive impact player in his minutes:
White has also shown a very consistent track record of improving every year in the league. This season he markedly improved his ball-handling and decision-making while maintaining the catch-and-shoot skill that has been his bread-and-butter since he entered the league. He will also be just 24 years old next season and could improve yet again.
Still, I have serious doubts about whether White makes sense as a starting point guard. Even if Coby improved by the same average amount that he’s improved over each of the last 3 seasons (+0.62 points per 100), that would land him at +0.72 which would put him at 23rd on the list of point guards who played at least 1500 minutes this year in LEBRON. That’s not really what you want from your starting point guard.
Besides that, there are huge questions of fit with the Bulls’ maximum contract star, Zach LaVine, on the defensive end of the floor. Both White and LaVine have improved and put in admirable effort on defense, but they are both never going to be positives on that end with their propensities for ball-watching, getting back-cut, and just plain blowing coverages. Playing the two of them together consistently against the best lineups the opponent has to offer seems untenable.
But there are additional concerns to worry about with Coby as the Bulls’ starting point guard next season. White is not a particularly good passer, as he has the natural instincts of a scorer and still very much plays like it, despite improvements on this element of point guard play. This season he had a 6.1 Passer Rating (Nikola Jokic’s 9.9 is the top of the scale) according to Ben Taylor’s Thinking Basketball Stats Database. For an idea of what a random assortment of elite offensive point guards look like on this metric: Tyrese Haliburton sports a 9.7, James Harden is at 9.3, Trae Young is an 8.8, and Dame Lillard comes in at 7.9. In addition to concerns about the quality of Coby’s passing is the fact that he does not bend defenses in a significant way for a potential primary ball handler. He generates about 4.5 open looks per 100 possessions for his team, according to Taylor’s Box Creation metric, a fairly anemic rate for a potential primary ball-handler. For context, a 4.5 Box Creation is the same rate of generating open looks that disappointing Knicks third option RJ Barrett produces.
A response to this is that White wouldn’t really be the primary ball-handler as those duties will likely once again fall into DeMar DeRozan’s hands next season. I have more to say about this in a separate blog, but I am of the opinion that the Bulls probably need to move on from DeRozan this summer and try to get some value for him. Ideally that value will be something along the lines of a couple of solid role players who can play defense and shoot threes on volume plus some draft capital (at least one first round pick, please). If the Bulls do bring DeRozan back, White is probably fine as a stopgap point guard, but I do not think it is his best role. White remains a fairly ideal 6th man, but the Bulls simply do not have enough good players to consistently place him there. Ayo Dosunmu did not meaningfully improve this season and was thoroughly miscast as a starting point guard and the combined lack of confident shooting and ball handling from Dosunmu and lottery disappointment Patrick Williams severely undercut the starting unit’s effectiveness.
If the Bulls are able to convert DeRozan into multiple good players and either sign or otherwise acquire, as part of a DeRozan trade maybe, a more compelling lead ball-handler than White, they should do so. Coby’s good and even better against second-unit talent, but to me, it can’t be Troll Boy and it can’t be Coby White as the Bulls’ starting point guard of the future. Coby White for a future 6MOY push, on the other hand, is something I can get behind.
Stable Player Impact (SPI) is a plus-minus impact metric that I have been thinking about building out for a while. Recently I got it to a point where I am ready to release it publicly. (Note that I reserve the right to tweak it and improve it without notice! I make no apologies!)
Stable Player Impact has very few original ideas. Instead I borrowed liberally from other people’s ideas, most of whom I consider friends or at the very least acquaintances. The biggest inspiration for and reason why I made SPI is Player Impact Plus-Minus (PIPM). In fact, when I was first building it out and telling others about it, I would simply call it “knockoff PIPM.” PIPM is the creation of Jacob Goldstein (with an assist from Nathan Walker on the development of the luck-adjustment for lineup data).
At the start of the 2020-21 season, fortunately for Jacob, but unfortunately for those of us who liked using PIPM in the public domain, he was hired by the Washington Wizards and PIPM went dark. Since then, I’ve wanted to recreate the metric for my own personal use, but I didn’t want to just do exactly what Jacob did, because well, that doesn’t feel very inspired and I thought there were some additional tweaks I could make to the process to maybe improve it. In broad strokes, however, the two metrics could be considered siblings or at the very least first cousins. They have very similar DNA.
Creating Bayesian Luck-Adjusted / Stabilized On-Off Data
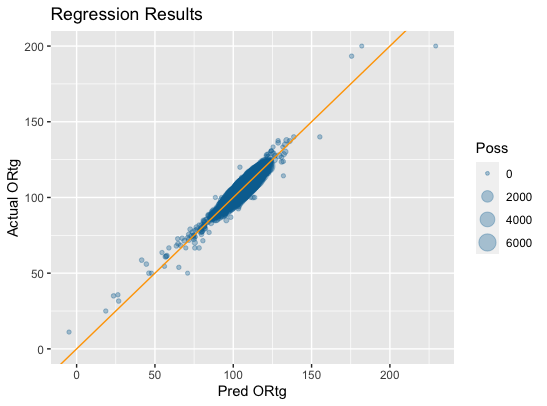
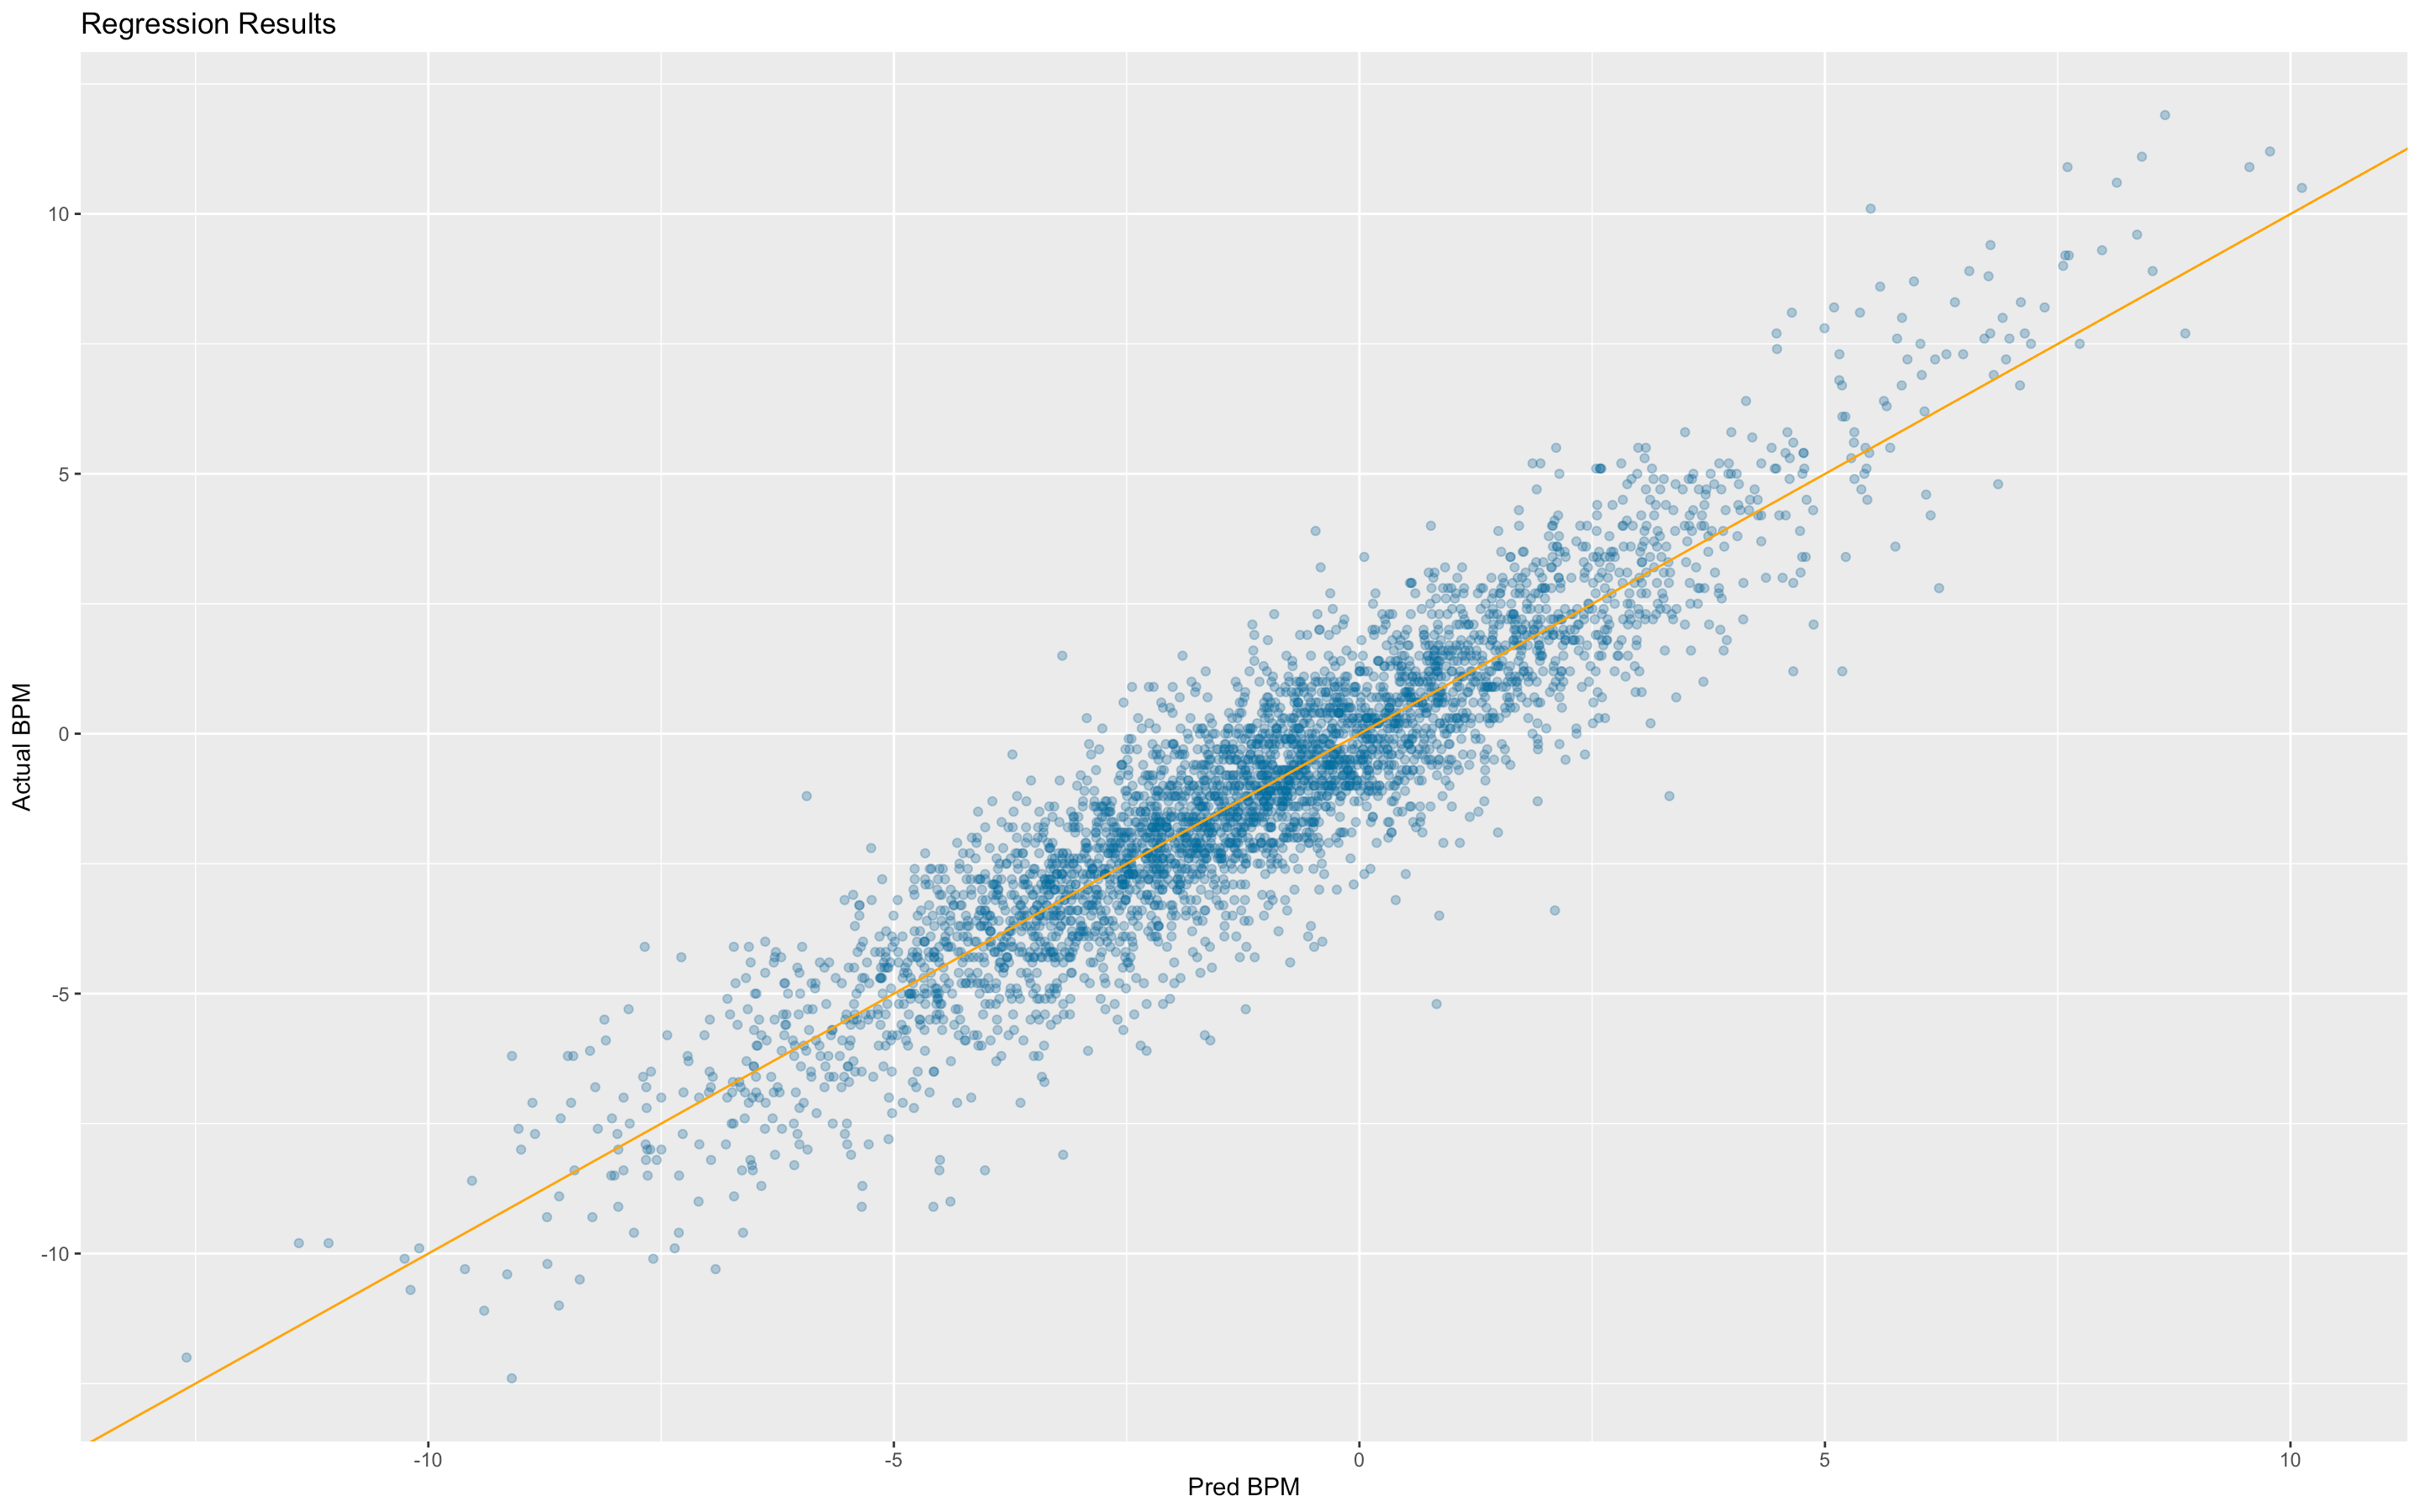
The core insight of PIPM was that on-off data could be “luck adjusted” using mean regression for different components of the four factors. This was accomplished using a leave one out regression using one game to predict the Offensive or Defensive Rating of each team for the other 81 games in a season across a number of seasons. I decided to take a similar but different approach. My approach considers the sample of possessions in both the on sample and the off sample for both the player’s team and their opponent to mean regress each of the individual components of the four factors using a method very similar to the “padding method” popularized by Kostya Medvedovsky, the creator of DARKO. I found the padding values used by using empirical Bayes, rather than differential evolution like Kostya used for the padding method on individual box score stats. I then plug these Bayesian, stabilized four factor component values into a formula developed via regression on data from 1997 to 2022 that has a .95 r-squared with player-on-the-floor Offensive Rating (plot of actual versus predicted ORtg below):
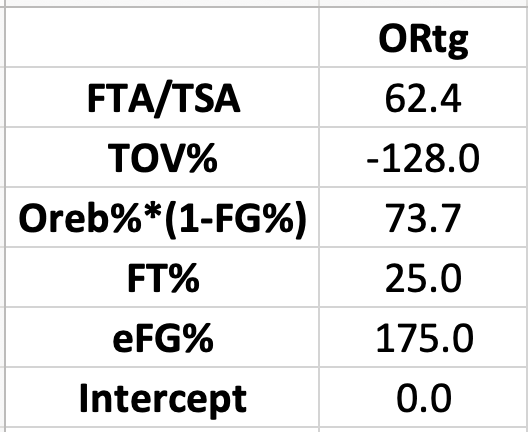
Here are the weights for predicting Offensive or Opponent Offensive Rating based on this regression:
TOV% here is TOV/(FGA+.44*FTA+TOV) and FTA/TSA is .44*free throw attempts divided by true shot attempts (FGA+.44*FTA).
Creating the Box Score Component
SPI was created using a regression against 26 year RAPM, provided to the public domain by former Suns analyst Jerry Engelmann, while PIPM was created using a 15 year RAPM basis (also via Jerry). Like PIPM, there is a box score component to SPI. It includes the same per-possession stats and Games Started % squared term as PIPM, although the weights are not exactly the same as the RAPM basis is different and I use per 100 possessions, rather than per 75 possession numbers. I also used 10×10 cross-validation for both the offensive and defensive box-score regressions to minimize overfitting. The r-squared on these heavily cross-validated values is .72 for Box O-SPI and .59 for Box D-SPI.
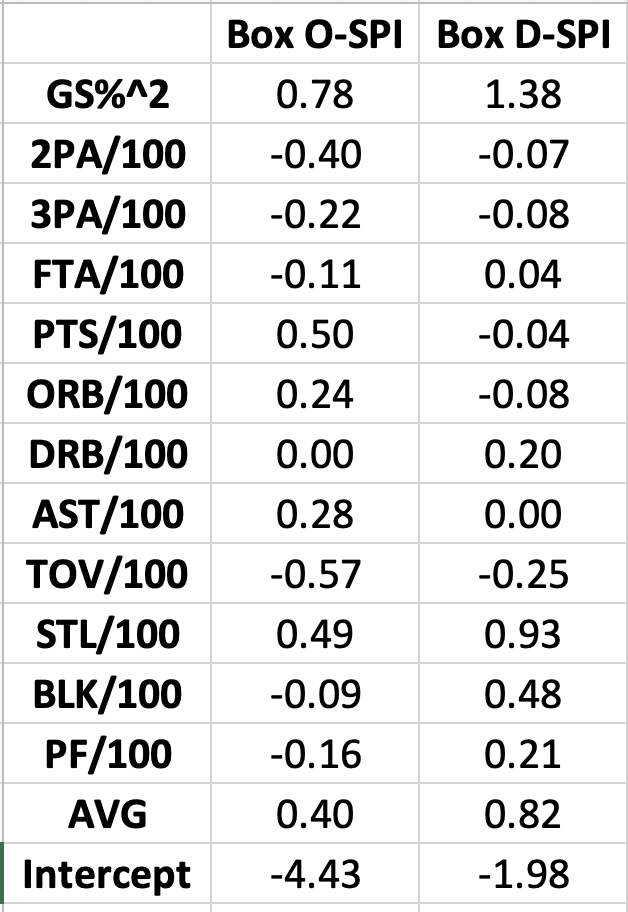
The box-score coefficients for SPI are as follows:
Where AVG is the team’s overall Bayesian, stabilized luck-adjusted ORTG or DRTG minus league average and multiplied by a player’s percent minutes played and GS%^2 is percent of Games Started squared.
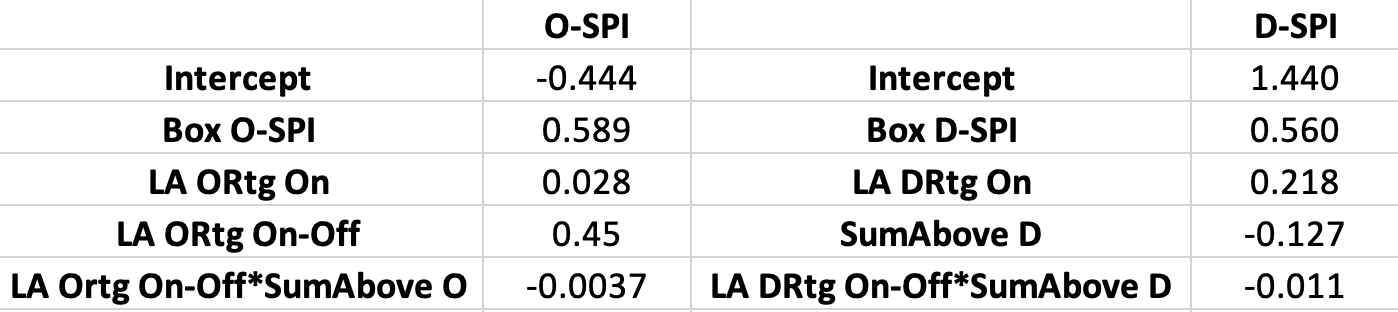
Creating Stable Player Impact
The box-score portion from above is coupled with the aforementioned Bayesian luck adjusted on-off data for each player using the following equation:
LA ORtg and DRtg On are the Bayesian, stabilized luck adjusted values for the team or opponent offensive rating from when the player is on the floor relative to the league average value for luck adjusted efficiency. The On-Off component is those On values with the same values calculated for when the player is off the floor subtracted out. Finally the “SumAbove” component is an idea borrowed from Ben Taylor‘s Augmented Plus-Minus metric (AuPM). I’ll let Ben explain it:
I played with the relationship between a player’s on/off and his teammates, and while many made minor improvements, the largest came from simply summing the difference of the 1000 MP teammates ahead of a player. For instance, take the following group of teammates:
Player A = 2.0
Player B = 5.0
Player C = 6.0
Player A’s “summed above” value would be the difference between himself and B plus the difference between himself and C, or 7.0.
I made a slight tweak and used players who had played 25% of team possessions, rather than 1,000 minutes played, as the comparison teammates for the player for whom we are calculating SPI and obviously we are using luck adjusted on-off data rather than raw data and have it split out for offense and defense rather than using Net On-Off like AuPM does.
These coefficients for SPI were also produced using regression with 10×10 cross validation and the r-squared for O-SPI to 26 year O-RAPM is .80 and for D-SPI to 26 year D-RAPM is .74.
Each component of O-SPI and D-SPI is also stabilized heavily. The box-score values are stabilized using the padding method values here, only regressed toward league average rather than the specific values Kostya shows which were essentially the averages over the time of the sample he used to find the right padding value. The on-off components are mean regressed using the amount of possessions that best minimized the error between year n+1 values and the season considered. This is all necessary because the spread or variance in these values is much larger in a single season than in the 26 year sample, for obvious sample size reasons.
The last aspect of SPI is a team adjustment in the same way as the original version of Box Plus-Minus (and the same adjustment I used in calculating the team adjusted for my version of WNBA “BPM”). These adjustments are more impactful very early in the season when the spread of the metric is very compressed (though I try to reduce this some by mean regressing team level opponent-adjusted performance early in the season), but they become very small as the season progresses.
Wins Created
SPI can be translated into Wins numbers by using the Wins Created method that Nathan Walker developed for any per-100 impact style metric, which goes as follows:
Team Games*(norm.dist(SPI*(% of team minutes played),0,12.5,1)-0.5+0.5*.2*(% of team minutes played))
That looks like a lot, but the logic of it is fairly simple:
SPI*(% of team possessions played) is a player’s contribution to the scoring margin for the team over the whole year, and the normal distribution can be used to estimate a player’s win%, using a standard deviation of 12.5, with the mean of 0. Then we back out an average winning percentage (-0.5) to get the player’s impact to an average team. Then we add back in the impact that an average player would have had in the same number of minutes as the player played (0.5*0.2*(% of team possessions played)) to finally arrive at the number of wins this player could have been expected to add to an average team. These win totals should sum very close to 1230 wins for a normal 82 game season.
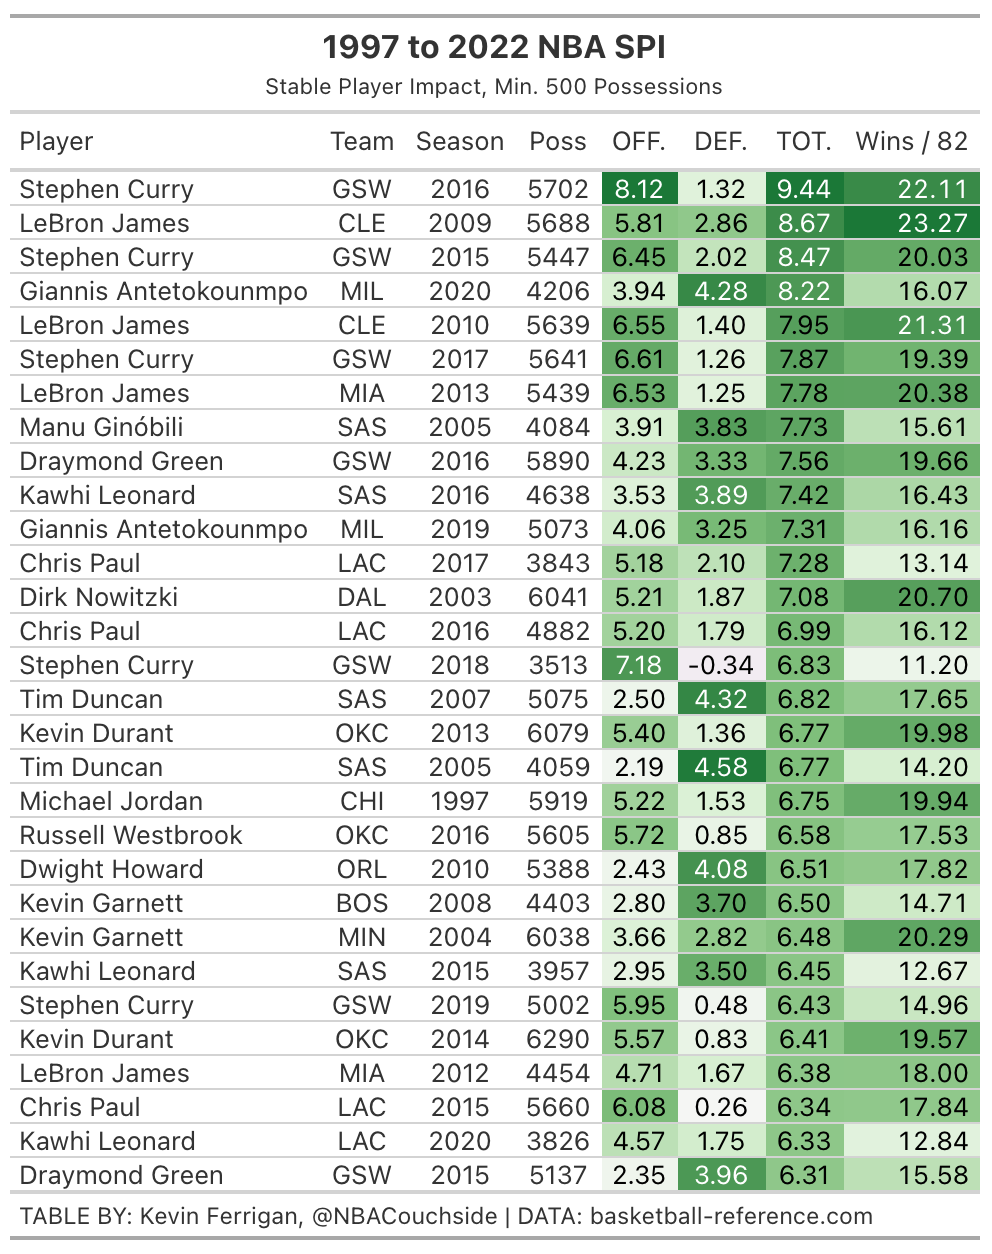
Results!
Here are the top 30 seasons in Stable Player Impact of the play-by-play era (1996-97 to 2021-22 seasons):
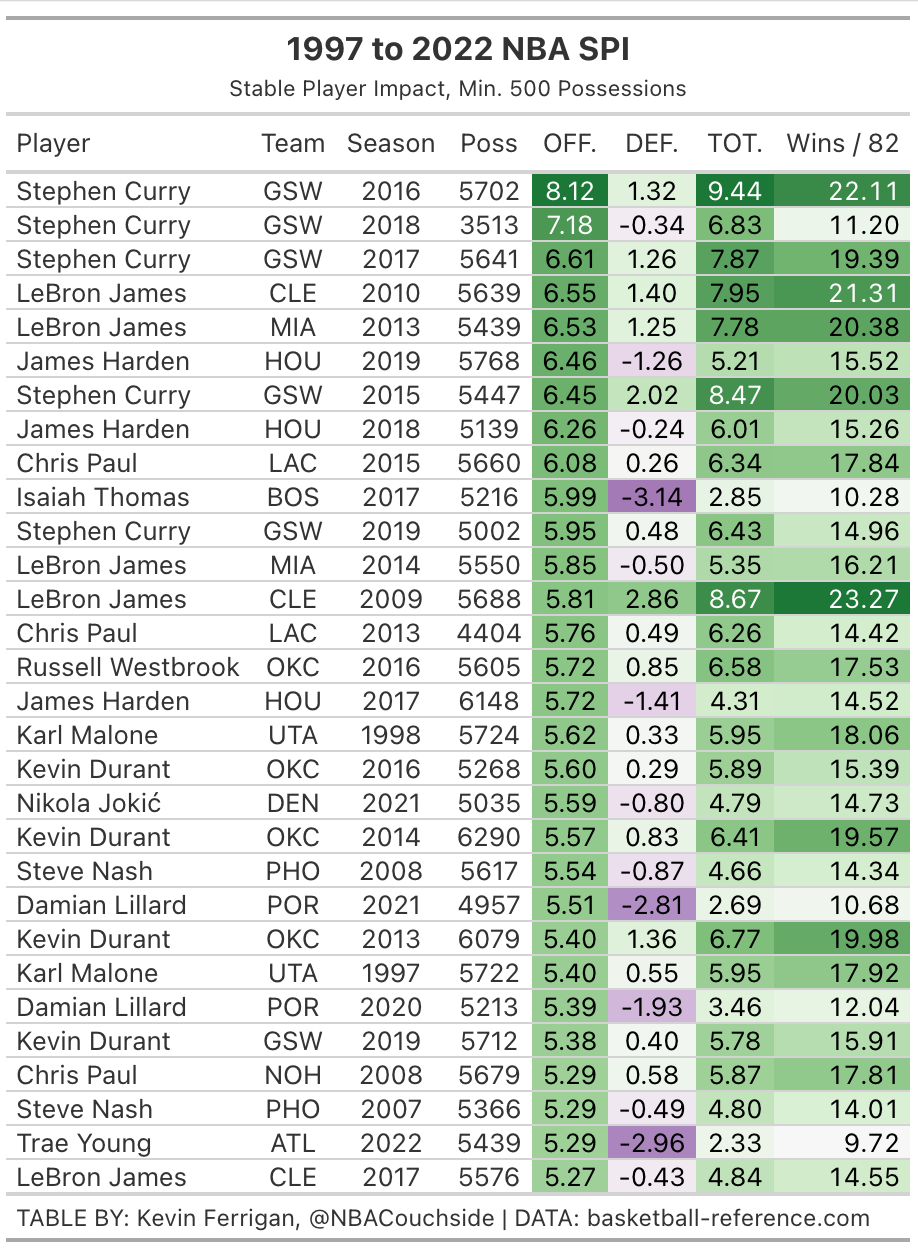
These are the top offensive SPI seasons in the play-by-play era:
Lastly, we have the top defensive SPI seasons of the last 26 years:
In the next few days, my aim is to have all of the last 26 years of SPI seasons up on a separate web page on this site, as well as the most up-to-date data for the 2022-23 season on its own page. In the meantime, here’s a link to a Google Sheet with the 1997 to 2022 data!
In the last couple of years, I have decided to get more into the WNBA. I love basketball and after more or less giving up on American football in the last half decade, I was left with a bit of a sports hole during the NBA offseason. As a result of becoming a W fan and more specifically a Chicago Sky partisan, I have wanted to peruse the same sorts of data tools I enjoy looking at for the NBA for the women’s game.
Sadly, many of my main go-to sites like basketball-reference.com, bball-index.com, backpicks.com, and nbashotcharts.com do not have great all-in-one (“AIO”) metrics or things on a similar scale to the NBA’s metrics for the WNBA. The good folks over at Positive Residual have a pretty solid WNBA AIO called Estimated Contributions (“EC”) which is a box-score informed adjusted plus-minus metric in the vein of ESPN’s Real Plus-Minus (“RPM”), dunksandthrees.com‘s Estimated Plus-Minus (“EPM”), and BBall-Index’s (“LEBRON”) metrics. In my own eyeballing of EC, however, it seems to pretty heavily index on team results and the scale seems to me overly compressed, which makes sense given its use of play-by-play on-off data and the W’s much smaller 36 regular season game sample size relative to the NBA’s 82 game slate.
I should note that Basketball Reference does have Player Efficiency Rating (“PER”) and Win Shares (“WS”) as available AIO metrics for the W, but it is fairly well known that those two metrics leave things to be desired. PER over-indexes on usage at the expense of, ironically, efficiency, while not accounting much for defense. WS over-index on scoring efficiency without properly considering usage rate — a proxy for shot difficulty — and team defense. If those foibles sound like they’re potentially complementary to you, congratulations, you’re correct! More on that in a minute. My favorite (and probably yours too, if you’re reading this) pure boxscore AIO metric for the NBA is Box Plus-Minus (“BPM”). If you’re unfamiliar with BPM, I’ll let its creator, Daniel Myers, speak for himself here, in describing the metric:
Box Plus/Minus, Version 2.0 (BPM) is a basketball box score-based metric that estimates a basketball player’s contribution to the team when that player is on the court. It is based only on the information in the traditional basketball box score–no play-by-play data or non-traditional box score data (like dunks or deflections) are included.
BPM uses a player’s box score information, position, and the team’s overall performance to estimate the player’s contribution in points above league average per 100 possessions played. BPM does not take into account playing time — it is purely a rate stat! Playing time is included in Value Over Replacement Player (VORP) which is discussed below.
League average is defined as 0.0, meaning 0 points above average or below average. Because above-average players play more minutes, there are far more below-average players than above-average players in the league at any time. A value of +5.0 means the team is 5 points per 100 possessions better with the player on the floor than with average production from another player. (In the 2018-19 season, teams averaged around 100 possessions per 48 minute game.)
Daniel created BPM using a regression of box score stats and position against adjusted plus-minus data to get properly weighted values for each component. I didn’t have access to pure adjusted plus-minus data for the WNBA and I didn’t feel like spending the time to , so in order to work around that and to create something easy to calculate I ran a regression on NBA BPM data using just three variables. Those variables were numerical position (where C = 5, PG = 1, etc.) which made sense as position was included in Daniel’s BPM calculation and the two flawed but okay AIO’s that already existed on Basketball Reference, PER and WS. (In order to scale PER and Win Shares to make sense on a BPM level scale I subtracted league average PER (15) from PER and league average WS per 48 minutes (.100) from a player’s WS/48.)
The result of my regression on the training set of 80% of player seasons selected from every season in the NBA with BPM, PER, and WS data was as follows:
1.07+.285*(PER-15)+26.7*(WS per 48-.100)-.426*(numeric position)
The r-squared for this regression on the testing set was .84 with a mean average error (“MAE”) of only .92 points per 100 possessions on the BPM scale. So it is a very strong proxy for actual BPM, with very simple inputs and is generally very close to the real deal. Here is what that looks like in a plot of the predicted versus actual data points on the training set.
Not bad!
It should also be noted that while both BPM and WS contain a team adjustment to scale production to team strength, PER contains no such adjustment, so it seems clear that the correlation for this predicted BPM would be even stronger once a similar team adjustment was made to scale predicted BPM to team results.
My next step was to take these calculations and apply the same scaling to WNBA PER and WS/40 to produce WNBA BPM. (The W plays 40 minute games so the league average WS/40 is .100 just like it was for the NBA WS/48, since .100 wins * 5 players on the floor equals .5 wins per 40 or 48 minutes, or roughly the length of a game, which is roughly an average.) After getting the raw calculations done, I mean regressed the results using 189 minutes of play at a -0.88 BPM level (ht: Krishna Narsu) to deal with outlier performances from low minute players in either direction, and then applied the team adjustment, which is as follows:
(1.2*NetRtgAdj-sum(player contribution))/5
where NetRtgAdj is Simple Rating System (“SRS”), a/k/a Margin of Victory per Game (“MOV”) + Strength of Schedule (“SOS”), scaled from a per game measure to per 100 team possessions. Player contribution is just (mean-regressed, raw BPM)*(% of team minutes played by player). The reason the team adjustment is set such that player contributions sum up to 120% of actual team strength is to normalize the environment to something like a league average team, because teams that are very good or very bad have a well documented and linear tendency to “rubber band” by either performing below their actual talent or above their actual talent, due to either their or their opponents’ effort changing based on being ahead by a lot, respectively.
Finally, these BPM numbers can be translated into Wins numbers by using the Wins Created method that Nathan Walker developed for any per-100 impact style metric, which goes as follows:
Team Games*(norm.dist(BPM*(% of team minutes played),0,12.5,1)-0.5+0.5*.2*(% of team minutes played))
That looks like a lot, but the logic of it is fairly simple:
BPM*(% of team minutes played) is a player’s contribution to the scoring margin for the team over the whole year, and the normal distribution can be used to estimate a player’s win%, using a standard deviation of 12.5, with the mean of 0. Then we back out an average winning percentage (-0.5) to get the player’s impact to an average team. Then we add back in the impact that an average player would have had in the same number of minutes as the player played (0.5*0.2*(% of team minutes played)) to finally arrive at the number of wins this player could have been expected to add to an average team.
The results of all of these calculations (as well as some metrics I calculated from the excellent Backpicks.com for the WNBA) can be found in the following Google Sheet:
I hope this was informative and someone finds this useful. Enjoy!
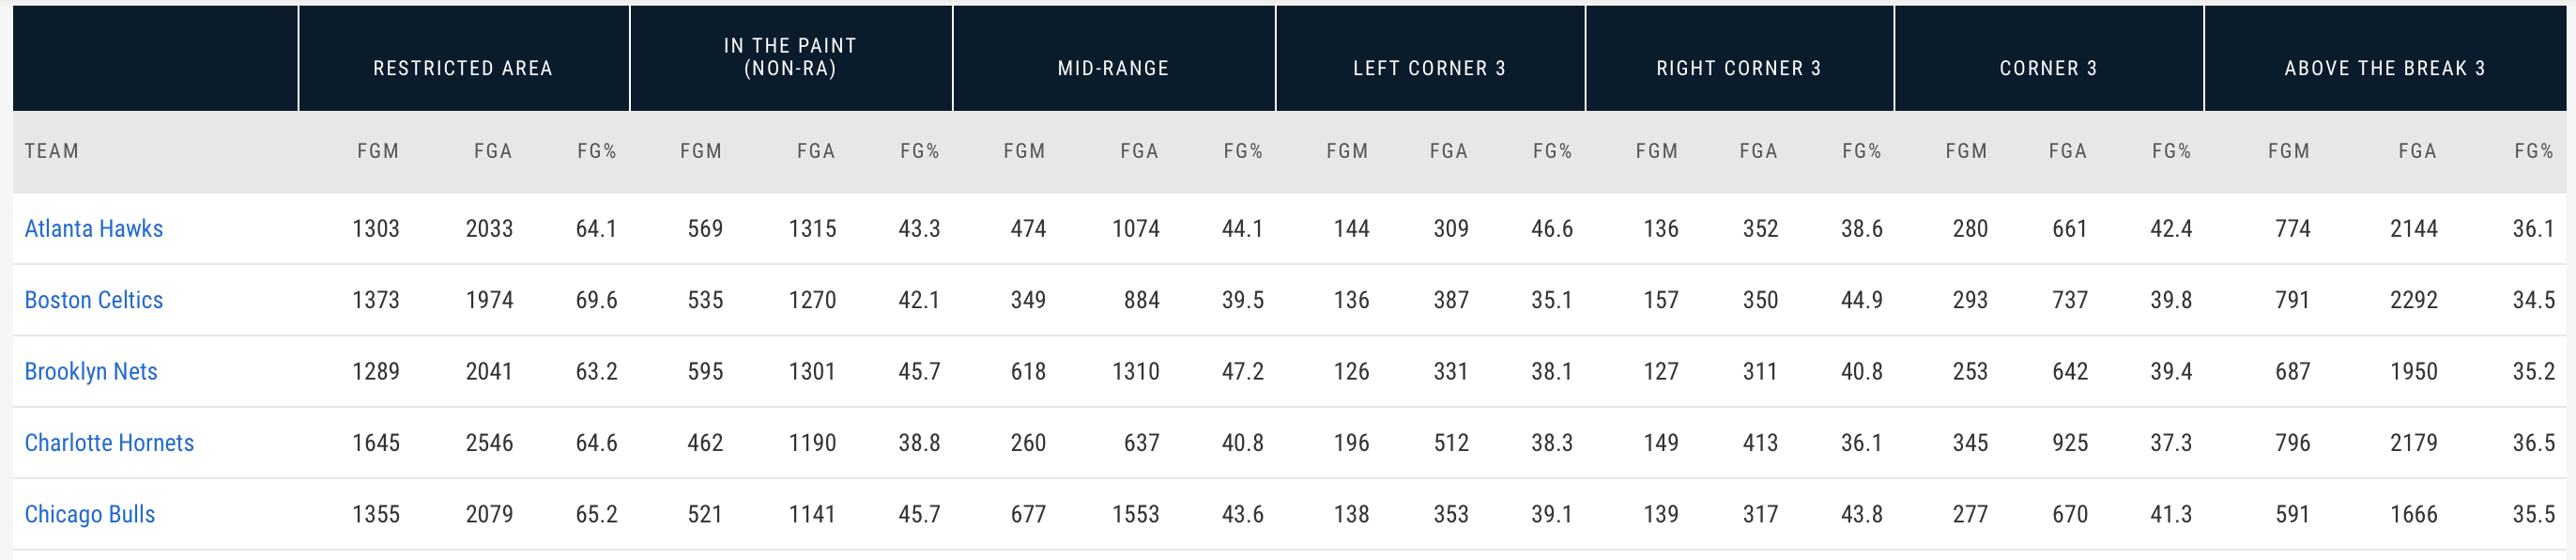
There are some things, as fans, you’d think would be immutable in terms of the data we have on basketball, especially at the NBA level. One of area you might expect to be immutable is the location or zone where shots are taken. A layup is a layup, a mid-range jumper is a mid-range jumper, etc. If you believe that, then you, like me up until a few weeks ago, have not dug in deep enough to the NBA’s shot location data.
It turns out that a restricted area shot is not always a restricted area shot and a mid-range jumper is not always a mid-range jumper. This is because shot location data is tracked by the home scorekeepers in each arena in the league and as such, it is subject to the bias of those scorekeepers. This is similar to another area of scorekeeping, the tallying of assists, which is a process that introduces a great deal of subjectivity to the process. Fortunately, adjusting for scorekeeper subjectivity is a somewhat solved problem, thanks to Jack Moore from Deadspin (not to be confused with the zombie Scabspin that currently operates at that url). Here is a link to Moore’s article detailing the process of adjusting assist numbers for scorekeeping bias or developing “Court Factors” as he called it (borrowing the concept of Park Factors from Sabermetrics).
Court Factors, as with Park Factors in baseball, are an attempt to adjust for differences in the environment that produce statistics. In baseball, the parks have different dimensions and additional weirdness (The Green Monster in Boston, for instance) which can produce these sorts of differences. In basketball, most of the differences in statistical environment come down to scorekeeping bias, hence the example of assists.
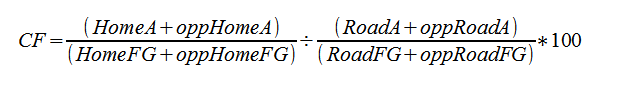
Jack Moore’s basic formula for Court Factors as applied to assists is as follows:
Simple and elegant.
We can apply a similar concept to adjust the shot location distribution for each bucket. As an example, here is what such a calculation looks like for a Restricted Area Court Factor:
RA CF = 100*(((Home_RA_FGA+OppHome_RA_FGA)/(Home_Total_FGA+OppHome_Total_FGA)) / ((Road_RA_FGA+OppRoad_RA_FGA)/(Road_Total_FGA+OppRoad_Total_FGA)))
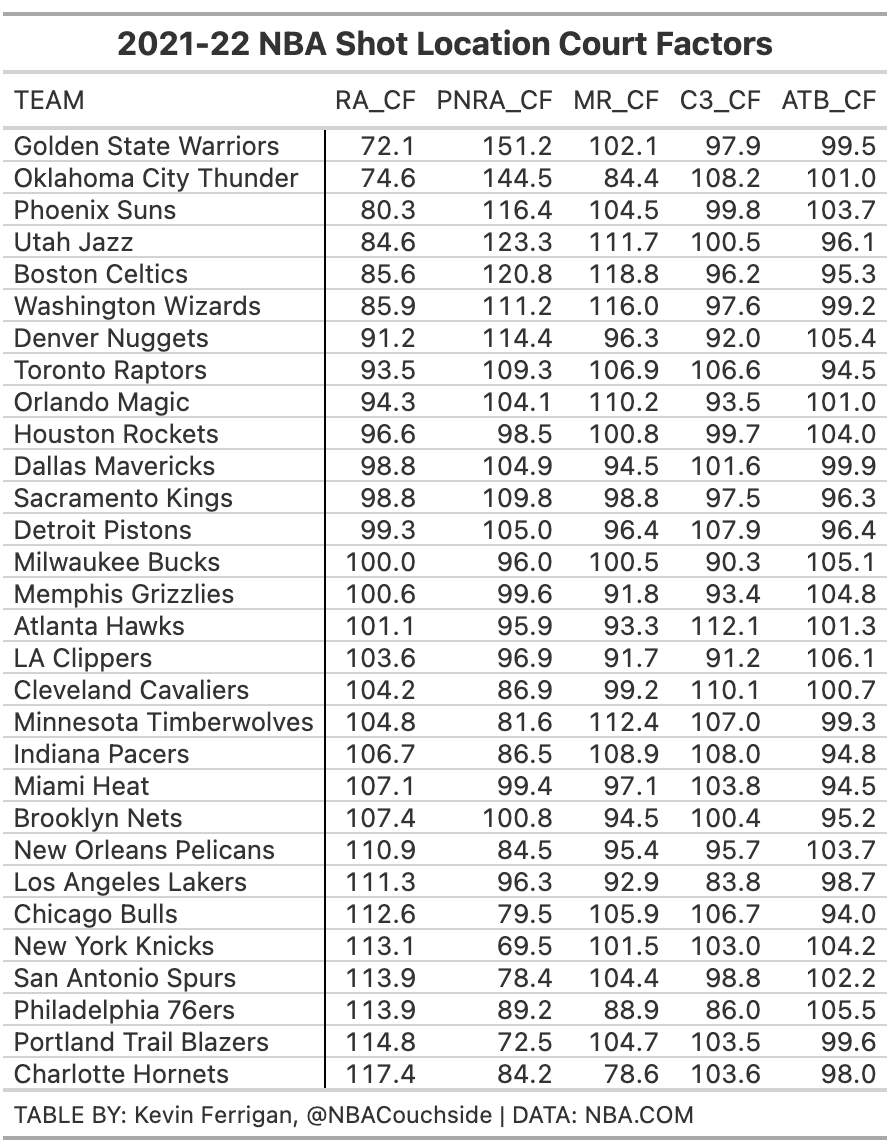
We can then run this for each shot location area and get the Court Factors for each shot location bucket for each arena (shown below).
In order to understand what these numbers represent, a lower Court Factor means that the scorekeepers at that arena are less likely to categorize a given shot into that shot location bucket, while a larger number means the opposite.
As we can see, the Golden State Warriors and Oklahoma City Thunder scorekeepers are the biggest culprits in terms of undercounting restricted area attempts and, as a result, overcounting in the paint, non-restricted area attempts.
Sorted, ascending by Restricted Area Court Factor
Note: RA = Restricted Area, PNRA = Paint Non-Restricted Area, MR = Mid-range, C3 = Corner 3, ATB = Above the Break 3, and CF = Court Factor
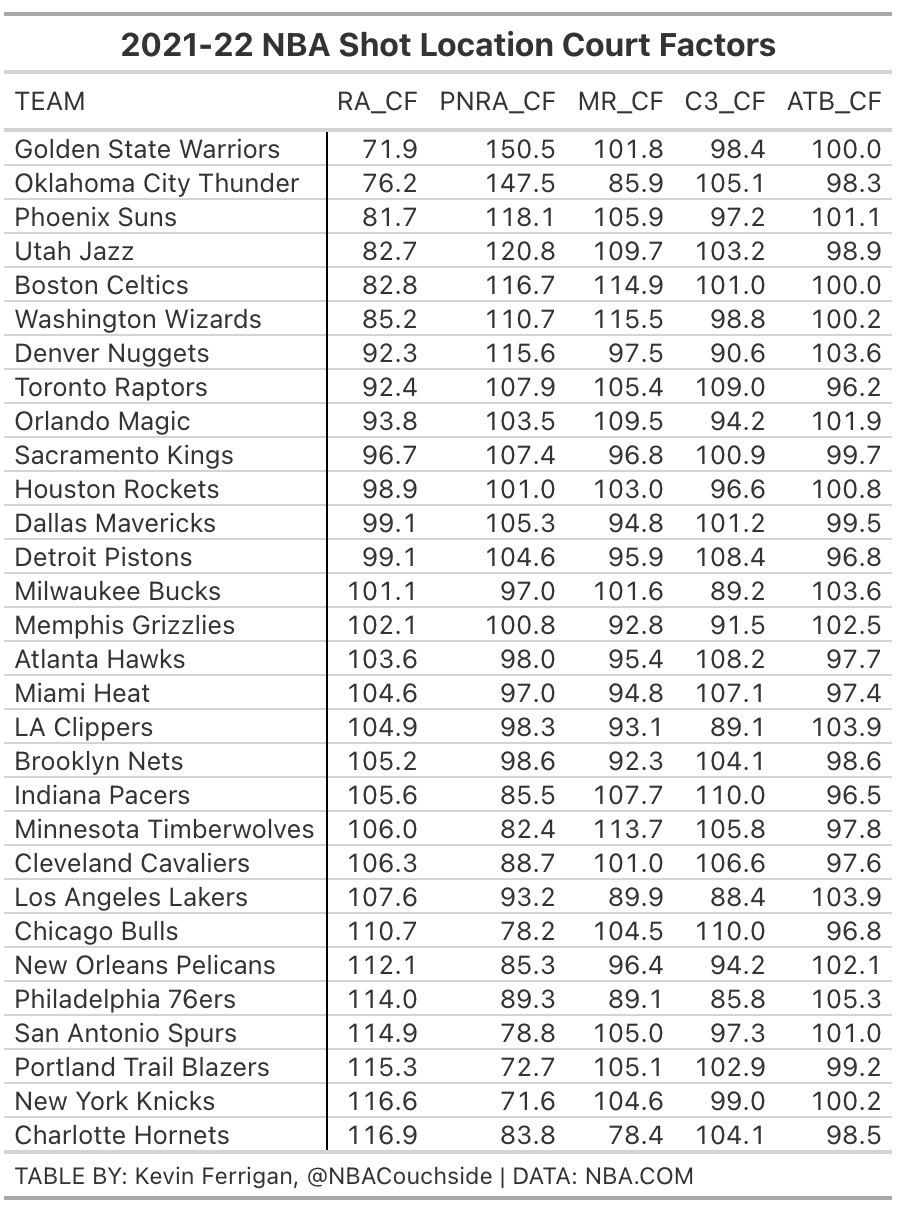
A possible update to this methodology might be to use two point attempts as the denominator in our formula for restricted area, paint non-RA, and mid-range attempts and then use three point attempts as the denominator in our formula for corner 3 and above the break 3 attempts. This makes sense as we should have more confidence in the refs getting it correct as to whether a shot was a two or three point attempt. As a result, we’d see more accuracy in terms of where the bucketing errors occur, e.g. missing restricted area attempts should generally come from paint non-restricted area attempts, unless the scorekeepers are just wildly off. Likewise, missing corner 3 attempts should come from the above the break 3 bucket and vice versa.
Here’s what those results look like:
As you can see, the results are largely the same. Of note in the three point category are the Chicago, Detroit, Cleveland, and Indiana scorekeepers all erring on the side of bucketing 3 point attempts into corner 3s, rather than above the break 3s. Must be a Central Division thing (ignore the Bucks!).
One caveat here that must be said is that it’s possible that some of these differences in bucketing are the result of genuine play style differences between being home and away for the given teams. The Bucks jump out as being a team that might just allow many fewer corner 3s at home versus on the road, given their well known strategy of conceding above the break threes over corner 3s or rim attempts. It’s possible they executed much better at home on that strategy.
Still, these results are significant enough (in particular the restricted area and non-RA paint categories) that its probably wise to consider adjusting for these factors, whether mentally or programmatically, when you’re comparing shot zone data from the league across different arenas.
Artūras Karnišovas, Chicago Bulls President of Basketball Operations, has a big decision to make this summer, if you listen to a certain segment of Bulls fans and Chicago media. Can you win big with Zach LaVine as a guy with a maximum contract on your team?
Of course, that is not at all the right question to ask and Karnišovas has hardly a decision to make at all. OF COURSE, you max out Zach LaVine. Why is this so obvious?
LaVine Has Earned a Maximum Contract
Getting this out of the way first, as it is the most relevant point here. Zach LaVine has turned himself into somewhere between a top 20 and 30 player in the league (evidence: no All-NBA teams, but back to back All Star berths), despite entering the league as a very raw project with interesting tools and a moldable skillset but a seemingly limited understanding of team basketball.
LaVine also did all of this improving despite being in a series of terrible situations, first in Minnesota and then in Chicago. He had 6 coaches in his first 7 years in the league, with this season with Billy Donovan representing the first time in his career that he had the same head coach to start back-to-back seasons. LaVine also refused to let suffering a torn ACL in his third season at the age of 22 stop him getting better. Simply put, LaVine has an incredible work ethic and that work ethic has been the Bulls’ one constant in the post-Jimmy Butler era.
LaVine’s last contract paid him only $19 million a season, on average, and it is very safe to say he outplayed that contract. It’s possible the Bulls former brass (Fire GarPax again, if possible, please) soured the relationship between the team and player all the way back then by making LaVine seek out a restricted free agency contract with the Sacramento Kings and matching it, rather than simply paying LaVine what he was actually worth. Hopefully for Bulls’ fans sake and the sake of the new front office group that damage isn’t fatal to keeping LaVine, who, it must be said, is an unrestricted free agent. This leads to the next point.
It’s Not About The Money, It’s About Respect
No matter where LaVine ultimately ends up this summer, he’s going to be incredibly well compensated for his services. That’s not really at issue here. One thing that the Bulls guard has made very clear is that, to him, the question of his compensation is about him feeling respected and treated like the player he has proven himself to be.
Here’s LaVine saying as much himself to ESPN’s Brian Windhorst last summer:
“I just want my respect, that’s the main thing,” LaVine said Monday after practice ahead of Team USA’s quarterfinal game against Spain set for Tuesday.”I outplayed my contract. I’ve been very loyal to Chicago. I like Chicago. I just want my respect. If that’s now or later, it’s something we’ve got to work out internally.”
Zach repeated this theme in his end-of-season press conference with Chicago media.
“It’s important to me. But you get paid what you’re valued at. I see myself as a top guy in this league, and I think I’ve proven that over the last four years. And I think that’s what we’re going to negotiate. I think that’s what Marc (Eversley), [Artūras Karnišovas], that’s what they and Rich are going to have to discuss.”
LaVine wants to feel like he’s being valued by the franchise and he feels like he wasn’t properly valued or respected on his last contract, because as he mentioned last summer to Windhorst and again in a back and forth with Joe Cowley in the same recent end-of-season press conference mentioned above, he outplayed his contract. He doesn’t have to settle for less than his value in unrestricted free agency and he has given every indication that he believes he should be receiving the maximum amount he can receive under the collective bargaining agreement.
Given that the Bulls already short-changed him, in his eyes, for the last four years, they have very little margin for error in their discussions with him, especially as there are a handful of teams with cap space to sign him outright to a max deal (granted those deals would be a year shorter and have smaller annual raises of 5% versus 8% he could receive with Chicago).
If Chicago messes around and tries to get cute by offering anything short of the 5 year, $212 million dollar deal for which LaVine is eligible, they increase their risk of losing him for absolutely nothing.
Lack of Liquidity in Talent Acquisition in the NBA
This gets to the last bit that really matters. The alternative to giving Zach LaVine the money he wants and, in his eyes and my eyes, he deserves is not that you get to offer that money to another, better mystery player. The two options to not paying LaVine are: (1) sign-and-trading him to some other team for a package of players that are worse than him and (2) losing him for nothing.
In a sign-and-trade situation, LaVine would be deciding which team without actual cap space he wants to go to, using the threat to leave for nothing to one of the teams with cap space as leverage to force the sign-and-trade and the Bulls would be getting whatever they could negotiate out of that team in trade negotiations. Given the current front office group’s propensity for losing trades on the margins, that’s not a scenario about which to be optimistic.
Even if they lose LaVine for nothing, Chicago is going to be more or less capped out, given the contracts handed out last summer to DeMar DeRozan, Lonzo Ball, Alex Caruso, plus Nikola Vučević’s $22 million expiring contract. At most, Chicago would have around $16 million in cap space if they lost LaVine to another team for nothing and renounced their remaining free agents for cap space. This should be obvious, but the Bulls are not finding another player better than Zach LaVine in free agency for a starting annual salary of $16 million a year.
In short, losing LaVine in the off-season, no matter the circumstances (sign-and-trade or having him walk for nothing) would be an utter disaster for the Bulls, without any further context. With the context of last summer’s offseason and the prior season’s trade deadline, it would be a franchise asteroid, putting them in a crater from which they might take a decade to dig out.
Chicago Already Went All-In on LaVine Last Summer
Karnišovas and Marc Eversley went all out to build a winning team this summer and last year with the moves to acquire Vučević, Ball, and DeRozan. This after Gar Forman and John Paxson left them with an already relatively bare cupboard after a poorly executed rebuild, kicked off by trading Jimmy Butler for way less than his full value. As a result, the Bulls are very asset poor. They’re out their 2023 first round pick, 2025 pick first round pick, and have no second round picks for as far out as the eye can see. They also didn’t have their 2021 first round pick this past summer, a pick which turned into Franz Wagner, who appears to be a future stud.
If the Bulls lose LaVine in the summer, they have to consider blowing things up all over again, especially if they aren’t able to make the loss a sign-and-trade for real value. The core of this team without LaVine is simply not good enough to make the playoffs, let alone to make any real noise in the playoffs in a significantly improved Eastern Conference. They’d have to trade DeRozan and Vučević for draft picks and see what value they could get for Caruso. Ball is probably untradeable at the moment with the concerns around his lingering knee injury. Most fans rightfully want no part of another teardown. I know I certainly don’t.
To use a poker term, Chicago is pot-committed to this version of the team and as a result, they absolutely have to everything they can to retain Zach LaVine’s services. That means offering him 5 years, $212 million and hoping the good feelings of the first three quarters of this season and the full bag is enough to keep him in the Windy City. It’s really the only option here and I think it’s what Bulls’ brass will do. Hopefully, it’s enough.
This is going to be a post that offers some criticism of the Bulls front office duo of President of Basketball Operations, Artūras Karnišovas and General Manager, Marc Eversley. Before we get to that, though, it must be said that the Bulls’ new basketball people did a very strong job in their first active offseason following their first year on the job, where they were in “evaluation mode.” Adding DeMar DeRozan, Lonzo Ball, and Alex Caruso in a single offseason, while hitting on the steal of the second round in the draft (well, save for “Not On” Herb Jones) in Ayo Dosunmu is a very successful offseason by any measure. Chicago leapt from a team that won at a 35 win pace, prorated to an 82 game season, to a team that won 46 games. Adding 11 wins to a team’s record and making the playoffs is a substantial accomplishment and the Bulls organization deserves kudos for trying to simply be better and give their city and fans worldwide a team worth their time. They largely succeeded. Speaking as a Bulls partisan, it was the most fun season in half a decade, at least.
Having said all of that, there were some areas where the new front office group came up short. Those areas were largely exposed by COVID absences, injuries, and the pressure cooker of a first round playoff series against the defending NBA Champion, Milwaukee Bucks.
These issues were not really in the big picture shifts, but instead in the marginal moves that defined how the team was built out around the stars and other core pieces. Why does this matter so much? I’ll let Ben Taylor of Thinking Basketball and Backpicks.com take it from here:
The data reflects common sense. As teams grow better, the players surrounding the star grow better. Improvements to the star himself are correlated with more team success, but the supporting players on a team are more important to the team’s success than the star player. This is expected; basketball is not a one-on-one sport. Still, it’s nice to be able to quantify this with a decade of non-box score data.
In other words, the true differentiator between bad teams and good teams and good teams and great teams is the supporting cast around the stars, despite what the hot take merchants and great men of history pushers would have you believe. Okay, so what does all that have to do with the Chicago Bulls?
“Too Small, Too Weak, Too Poor”
In a cruel inversion of Stacey King’s famous call, often made on Derrick Rose’s behalf, “too big, too strong, too good,” Chicago’s role players outside their top 6 players (DeMar DeRozan, Zach LaVine, Nik Vučević, Lonzo Ball, Alex Caruso, and Pat Williams) were simply “too small, too weak, too poor.” They didn’t have an adequate combination of size, strength, and skill to hold up over an 82 game season, nor could they go toe-to-toe with Milwaukee’s role players in the postseason.
This team spent large swaths of the season with 6’4″ Javonte Green in the starting lineup guarding front court players more often than not. Green is a spectacularly fun and energetic player and has a place in a rotation, especially over the grinding slog of 82 tilts in a 6 month window that is the league’s regular season. He should be nobody’s starter, however, and the lack of reasonable big wing, four man options available to Billy Donovan after Patrick Williams’s unfortunate freak wrist dislocation was an enormous problem for the Bulls. While he provides hustle and muscle, Green is physically outgunned in most matchups and doesn’t command the respect of a single NBA defense as an offensive threat, beyond as a transition terror and put-back dunk dynamo. This is because, like most of the Bulls non-core players, Green was simply not a shooter or dribbler worth fretting over.
Two players with similar warts to Javonte and less to recommend them, given their lack of his physicality and energy are Derrick Jones Jr. and Troy Brown Jr. Neither player can shoot in a way that frightens foes and they aren’t significant threats with the ball in their hands, despite Brown Jr.’s profile as a theoretical do-a-bit-of-everything-well wing. The reality of TBJ is more a what-does-he-really-do-well-actually? wing. Having three role guys who all are kind of the same guy in their weaknesses without many bit players on the roster who have those weaknesses as strengths is a recipe for problems. This is doubly true for Chicago, given that fully 4 of the Bulls’ top 5 players are guard-sized, with only the much (unfairly) maligned Nikola Vučević providing any true combination of height and heft. As a result, Vučević was overtasked often this season on the glass, while Ball and Caruso were ground down by too often guarding the league’s thickest and strongest wings and big forwards. There’s no data here to prove the point, but it’s hard not to believe that Chicago’s multiple injuries to their defensive cornerstones Ball and Caruso, as well as the aforementioned DJJ and Javonte Green, were the result of the pounding inflicted by perpetually playing up.
Finally, at some point in the season, Billy Donovan decided that Tony Bradley Jr. simply couldn’t really play for him and opted to give minutes to the guy who used to be Tristan Thompson instead. Presumably this had something to do with Tony’s metacarpals being made of minerals.
They’re minerals, Marie!
The problem, of course, is that Tristan Thompson has been somewhere between worthless and actively harmful on a basketball court and in a locker room for multiple years running. This, of course, continued in Chicago. Thompson has been terrible and Chicago’s good vibes, propensity to fight for each other, and problem-solve professionally and collaboratively, all took a notable dip when he arrived. Still, Donovan’s lack of trust in Bradley Jr. makes some sense, as the old ball coach wants his big men to be able to make reads in the short roll and, well, that’s impossible to do if you can’t catch the ball in traffic. (We’ll ignore, here, that while Tristan can catch the ball, he will only ever make the wrong decision with it.)
How Did Chicago Get Here?
Some of these failings were the result of terrible COVID-19 luck and Mitchell Robinson’s being a bit of a reckless doofus, but bad luck and reckless doofuses are things for which you have to have prepare when roster building in this league. Patrick Williams being the only true big-wing, power forward sized player on the roster is simply bad planning.
There were opportunities to do better. Coby White should have been traded in the offseason for someone, anyone with at least two of size, strength, and skill. Coby is skilled, but undersized and very weak. He’s also massively redundant on a team that includes Zach LaVine, Lonzo Ball, Alex Caruso, DeMar DeRozan, and even, Ayo Dosunmu. While we’re at it, White’s skill-level, strong as it is, often doesn’t translate to actual success, as his processing speed and decisionmaking generally leave much to be desired, on both ends of the court. Ideally a Coby swap would have brought someone with wing size and a reasonably good jumper on the catch. I can forgive the lack of a Coby trade, somewhat, due to his offseason shoulder injury that likely tanked his value during that window. He could have been moved for help at the trade deadline, though, and I think he ought to have been.
Derrick Jones Jr. could have and probably should have been Larry Nance Jr., instead. In the sign-and-trade deal that sent Lauri Markkanen to Cleveland, Nance Jr. was the asset that the Cavaliers sent out in order to get the Big Finn in their building. The Bulls’ braintrust opted for DJJ and a protected possibly-maybe-but-good-chance-it’s-not first round pick from the Blazers, over cutting Portland out of the deal and simply taking Nance for themselves. Nance is simply much better than DJJ, to my eyes, and more than that he would have provided the Bulls with additional size both in height and bulk. After being dealt a second time by the Blazers for very little to New Orleans, Nance has demonstrated his value under the bright lights of the playoffs getting significant minutes against the regular season’s best team, your Phoenix Suns, while Jones Jr. has been relegated to an end-of-bench rotation piece against Milwaukee.
Management also had an opportunity to add additional talent and talent that fit a need on the roster, if they had simply cut Matt Thomas to sign Stanley Johnson for the rest of the season. Some of this was determined by the Bulls’ seeming COVID-19 curse, with Johnson getting the novel coronavirus immediately after being brought on as a pandemic hardship signing and just as quickly being cut. It didn’t have to be that way, though. The Bulls’ head honchos could have just given Johnson a standard minimum contract, rather than the hardship deal he was on, and to reiterate, let go of Matt Thomas, who provided effectively nothing all year and especially did nothing to solve Chicago’s biggest role player issue: lack of big wing size and strength. Johnson is a 6’6″ 240 pound brick house and a tenacious point of attack defender who would have helped immensely in the holiday-season doldrums where the Bulls were down large chunks of their defensive personnel for weeks and weeks. It didn’t have to be Johnson, either. Anyone in Johnson’s mold would have been much more useful for this roster than Thomas, who was too small and weak, and his jumper too inconsistent given the first two.
Signing Tony Bradley Jr. and his notably bad hands when your head coach insists that his centers, including backups, must be able to catch the ball and make passes and reads as a pressure release valve is bad planning. It’s doubly bad planning when Isaiah Hartenstein was on the free agency market, flapping in the breeze well past the point at which Chicago’s decision-makers had already committed to Tony B. Hartenstein had to sign a training camp deal with the Clippers, and his deal wasn’t even fully guaranteed until midway through the season! All of this despite Hartenstein’s well-demonstrated cromulence as a short roll decisionmaker, in-a-pinch scorer, and defender in stops in Houston, Denver, and Cleveland prior to landing in Los Angeles. Signing Hartenstein also likely would’ve given the Bulls’ bosses little reason to consider giving Tristan Thompson a look, let alone a piece of the biannual exception, limiting their options for the summer of 2022.
Nance Jr., Stanley Johnson, and Hartenstein would have been much better moves on the margins than Jones Jr., Matt Thomas, and Tony Bradley Jr. / Tristan Thompson. Of course, maybe all of this is only obvious with the benefit of hindsight, but if the front office had identified the problem of being too small and weak and too unskilled they might have made these or similar moves. An obvious objection here is that none of these three would have solved the Bulls’ “others” lack of shooting prowess, but at the very least, the defense would have held up better in the prolonged absences of Caruso, Ball, and Javonte Green. Hard Rock’s short roll passing also may have been enough offensive WD-40 with bench units to paper over some of the spacing concerns. An in-season trade of Coby White for a similarly priced defensive wing shooter would have helped here, too.
This is all to say nothing of the marginal losses of giving up too many picks in the Vučević and DeRozan swaps, nor the mistake of trading a good, young cost-controlled center in Daniel Gafford for Troy Brown Jr. who is… still kind of young and little else worth mentioning. In fairness to Karnišovas and Eversley, though, Javonte Green on a minimum contract was part of that deal and easily the best part of it for Chicago.
What To Do About All This?
Karnišovas and Eversley must spend this offseason rebuilding the Bulls’ 8-15 spots on the roster. DeRozan, LaVine (more on him and his impending free agency soon), Vučević, Caruso, Ball, Williams, and Dosunmu should all be back. (Javonte can probably stay, too, given all the surplus value he provides over his remaining one year, minimum salary deal.) Everyone else can and likely should be replaced.
Trading Coby this summer must happen, as he is unlikely to be someone the Bulls can or should pay his next deal, given likely cost and roster redundancies. Unfortunately, White has largely been an eyesore these playoffs on both ends, so he’s unlikely to return more than marginal talent, especially on his expiring deal, even with the restricted free agent rights that come with said deal. Get anything of value you can and move on.
Drafting for need is a mug’s game, but if the best player available calculus says there’s a tie, go for the player with the big wing size, strength, and shooting, please. I’m not NOT talking about Tari Eason and/or EJ Liddell, here.
Besides trading Coby and their first round pick, the Bulls’ other tools for improvement are some form of the midlevel exception (tax-payer or otherwise), the Daniel Theis $5 million traded player exception (TPE), and veterans’ minimum deals. If they can convince the Thunder to fork over Mike Muscala (a shot-blocking, three point shooter with a bargain price-tag) for the Theis exception, that’d be a nice bit of business, however unlikely it may be. Maybe Thaddeus Young is interested in returning to Chicago on the cheap. Maybe one of Kyle Anderson or either Martin twin can be had for the midlevel exception. What will Taurean Prince fetch? None of these are perfect fits, but they’re clearly better options than those Donovan had this season and someone should be gettable.
You gotta be able to make open shots, man!
Even a player like Ben McLemore on a minimum contract would provide much more of a spacing threat, if nothing else, around the Bulls core than the current players so that a team like the Bucks couldn’t surrender 19 corner three pointers in a single playoff game with little worry that it would burn them.
I, a random blogger on the internet, obviously, don’t have all of the answers for how to fix the Bulls’ 8-15 spots this offseason. That’s ultimately not the point, nor am I qualified or interested in gaming out every possible option. I would like to present some general principles for the Bulls’ roster building around the core 6 guys, though.
Get players who:
defend well enough across multiple positions that they aren’t playoff targets
must be respected as shooters and quick decision-makers
Sounds very simple but given how valuable the “others” are in making a team great and the preference for that combination of skills league-wide, it will be a major challenge, but hey, that’s the job. Whether the Bulls are able to get proven vets in these spots with these talents or are able to make some international ball or G-League finds is irrelevant for our purposes, but bottom line, they must find these kinds of players to improve the roster.
Oh, and find a back up center that can catch and pass the ball!
Artūras Karnišovas, the Chicago Bulls’ new head decisionmaker, has had a bunch of big decisions to make early in his tenure. He fired Gar Forman, Jim Boylen, disempowered John Paxson, hired new general manager Marc Eversley, and swooped in to grab Billy Donovan as soon as he came on the head coaching market. His next big set of decisions to make revolve around the draft (about which I may post thoughts in this space at a later time), but after that, perhaps no decision will be more consequential than what Karnišovas decides to do with Finnish big man, Lauri Markkanen.
Markkanen is a player that feels very hard to get a bead on. This may be the result of motivated reasoning and wishful thinking for me, given that I am regrettably still a Bulls partisan. If I try to put a more objective lens on him, he looks like a player who has played three years and hasn’t really meaningfully improved at anything and doesn’t bring a single standout skill in his time as a professional.
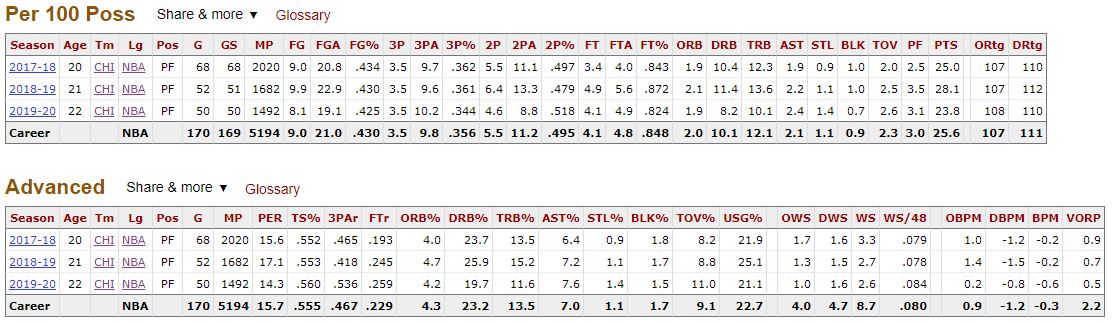
Markkanen’s Box Plus-Minus (BPM) has hovered around just below league average ever since his rookie year, and the same can be said for his Win Shares per minute and PER. For what it’s worth, Markkanen’s more holistic impactmetrics tell a broadly similar story of mediocre to incredible average-ness. Drilling down under the hood to what goes into those box-score all-in-one numbers, Markannen is essentially league average at scoring efficiency: 99% of League Average TS% every year for each of his seasons at slightly above average volume, he is mediocre at rebounding for a big man, his block and steal rates are nothing to write home about, and he’s a pretty dreadful passer by assist rate.
Markkanen’s low steal and block rates and poor passing numbers are a carryover from his time in college at University of Arizona (see above). This similarity to his college stats is important because it gives additional credence to the idea that this is part of who Lauri is as a player and not just the result of a crummy situation in Chicago, spending the majority of his career being coached by Jim Boylen, the worst head coach in the league the last two seasons in the estimation of this writer. That’s not to say that Markkanen couldn’t have looked better in a better situation or improved more under better coaching, but it is to say that he is probably deficient when it comes to event generation on defense and court vision on offense in a way that seems fairly unlikely to change.
One thing that has not carried over from Markkanen’s collegiate career to his professional years has been his dead-eye shooting from deep. Markkanen was a 42% three point shooter on healthy volume — 163 attempts — at Arizona and paired that with a free throw percentage of 83.5%. Every indication we had from college was that Markkanen would, at the very least, be a 7 foot marksman at the NBA level. Instead, Lauri has shot 35.6% on 1,050 attempts thus far in the league, almost exactly league average on significant volume. That’s certainly good enough to command some attention and demand a close out, but almost certainly not good enough to panic and warp a defense in the ways he might have been expected to as a prospect.
Markkanen’s shooting is even worse when you consider that the vast, vast majority of his shots from behind the line have been of the catch-and-shoot variety, typically a much easier shot type. In his rookie year, 371 of his 391 three point shots were catch-and-shoot looks and he converted at his 36.9%. In 2019, 301 of his 326 attempts were catch-and-shoot attempts and he shot just 36.5% on them. This past season, 302 of Markkanen’s 317 attempted threes were catch-and-shoot opportunities and he shot only 34.4% on them. So Markkanen is seeing a huge portion of his looks coming off passes, which should make them easier shots and he’s shooting at a well below league average mark on catch-and-shoot shots. I don’t have access to the Second Spectrum shot quality data, but given the above, it’s almost a certainty that Markkanen’s scoring is well below average given his shot profile.
But wait, it gets worse! Markkanen’s shooting splits when viewed through the lens of whether he was guarded versus un-guarded make his league average shooting percentages look even less impressive.
Markkanen shoots decently above league average on wide-open or “NBA open” (nearest defender 6 feet away or greater) a very strong 42%. However, when you introduce even the slightest amount of resistance (defender within 4-6 feet, called “Open” by the NBA stats page), his percentages go into the tank. He shoots 6 percentage points below the league average on these shots. Lauri doesn’t shoot a meaningful number of threes outside of these two guarded contexts, so they are really the only ones worth discussing.
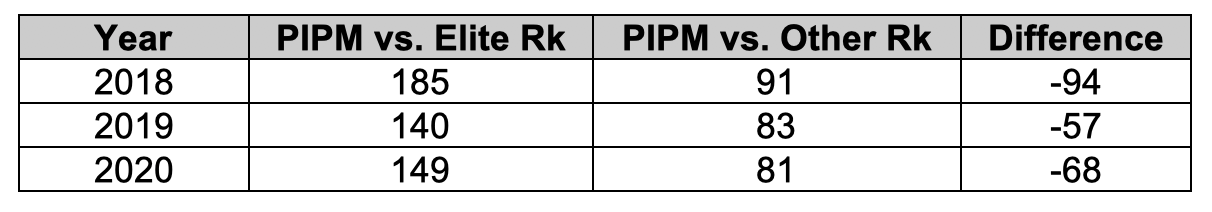
Shooting isn’t the only context in which Lauri looks lacking when he runs up against greater resistance. I took a look at Player Impact Plus-Minus broken out by opponent, split by top 10 opponents and the remaining 20 opponents, based on adjusted net rating. I filtered for only players that played a minimum of 500 minutes against each group of opponents. In every year of his career, Lauri ranks significantly worse amongst that group of players in PIPM against top 10 teams versus against the dregs of the league.
When the going gets tough, Lauri’s game gets going.
Looking at the whole picture of Lauri Markkanen’s career it is very hard to build a case for the Bulls to be excited about trying to keep him with an extension or an RFA contract next offseason. Markkanen is a 7 foot shooter who brings very little else to the table and even then, pretty much only shoots well when he is absolutely wide open. He’s an awkward defensive fit on a good team as a guy who provides absolutely no paint deterrence for opponents when he plays either PF or C and who can’t guard wing players when opponents downsize at the PF position.
According to Jacob Goldstein’s PIPM contract value projector, Markkanen is worth roughly $16 million a season going forward on his next deal. But, as I hope I’ve made clear, Lauri’s PIPM probably overstates his value, because he consistently fails to bring it against the elite teams in the league and instead does most of his damage bum-slaying the worst teams in the league. As a result, if you’re trying to build a high level winner, even committing $16 million a season to an extension for Markkanen is probably too much.
I’m kind of obsessed with trying to figure out which all-in-one metrics best measure player productivity and goodness in the NBA. I’ve built a basic statistical plus-minus in the past, called DRE, which essentially functions as an updated version of John Hollinger’s GameScore, only with more accurate weights.
I spent a lot of time tweaking and refining the models for offense and defense to attempt to maximize predictiveness out-of-sample. (Methodological note: I utilized the caret package in R, using the “glmnet” method, and 10×10 repeated cross-validation to arrive at these values). I gave a lot of thought to different variables to include and which variables to drop due to obvious collinearity issues, as well issues of overfitting based on variables being included that just made no basketball sense.
For projecting Offensive LA-RAPM an elastic net model proved best for maximizing out of sample prediction. For Defensive LA-RAPM a LASSO model was best. For Tracking Plus-Minus Offense, the following variables and coefficients were selected:
FG2M_100: 2 Point Field Goals Made per 100 possessions
FG2A_100: 2 Point Field Goals Attempted per 100 possessions
FG3M_100: 3Point Field Goals Made per 100 possessions
FG3A_100: 3Point Field Goals Attempted per 100 possessions
FTM_100: Free Throws Made per 100 possessions
FTA_100: Free Throws Attempted per 100 possessions
ADJ_ORB_PCT: Adjusted Offensive Rebounding Percent — the percentage of offensive rebounds per chance, excluding rebounds deferred to teammates
AST_PTS_100: Points assisted on per 100 possessions
TOV_100: Turnovers per 100 possessions
DIST_OFF_TOP: Distance (in miles) traveled on offense / time of possession on offense (hat tip to Krishna Narsu for suggesting this variable)
STL_100: Steals per 100 possessions
MPG: Minutes per game
In looking at the variables and their relative values it seems that the regression matches general basketball sense. Efficiency and volume (in scoring as well as passing) is highly prized. Adjusting for deferred rebounds to get a picture of a player’s rebounding prowess when actually trying helps better separate the best rebounders. Turnovers are bad. Off-ball movement (measured by proxy via the amount of distance traveled per time of possession) brings additional value. Steals create easy offense and serve as a positive athleticism proxy.
On the defensive side of the ball the r² on the resampling results was lower (.50 for offense v. .39 for defense), while the root mean squared error (RMSE) was actually very slightly smaller for predicting Defensive Luck-Adjusted RAPM (1.38 for offense v. 1.37 for defense). The variables and coefficients selected are:
The variables not already defined above are as follows:
DREB_CONTEST_PCT: The percentage of defensive rebounds a player collects that are actually contested
DRB_100: Defensive rebounds per 100 possessions
LT6_2PTS_SVD_100: Points Saved per 100 possessions within 6 feet of the basket (calculated using the tracking data)
GT6_2PTS_SVD_100: Points Saved per 100 possessions outside 6 feet, but still on 2 point shot attempts (calculated using the tracking data)
DFG3_PTS_SVD_100: Points Saved per 100 possessions on 3 point shot attempts (calculated using the tracking data)
OFD_100: Offensive fouls drawn per 100 possessions
We can see from these coefficients that offensive load (proxied by made 2 point shots, attempted 3 point shots, free throw attempts) generally carries with it a negative effect on defense, all else equal. In addition, shot defense seems to matter a great deal, as points saved from each area of the court mattered (though to slightly varying degrees). Steals and offensive fouls drawn pair to provide significant predictive value, which mirrors the work of others. Interestingly, when shot defense is accounted for, blocks are no longer needed to predict defensive impact. Finally, MPG remaining a predictor of defensive impact, even when controlling for these other variables, shows that coaches are able to provide us additional valuable information about which players are best at defense.
After developing those weights, I utilized a mean-regression method via Jacob Goldstein to add 350 minutes of -1.7 points per 100 possessions impact of offensive play and 450 minutes of -.3 points per 100 possessions impact of defensive play, which is one of the ways he mean-regresses his metric, Player Impact Plus-Minus (“PIPM”).
After that, I calculate the league wide difference between possession-weighted Tracking Plus-Minus for both offense and defense and 0 and then adjust the numbers so that the league is zero sum on both offense and defense.
Now for what most of you have probably been waiting for, the results!
The whole 6 years of results (2013–18 is in sample while 2018–19 is out of sample) can be found here.
2018–19 Results
Top 20
These results jive pretty well with my own eye test and the top 3 in MVP voting also made it into the top 3 of the metric, albeit in slightly different order. I feel pretty good about the results overall.
Hope you enjoyed! I should have more to come on Tracking Plus-Minus, as I’ll be utilizing it to predict win totals for this year’s NBA season before the season stars.