
In the last couple of years, I have decided to get more into the WNBA. I love basketball and after more or less giving up on American football in the last half decade, I was left with a bit of a sports hole during the NBA offseason. As a result of becoming a W fan and more specifically a Chicago Sky partisan, I have wanted to peruse the same sorts of data tools I enjoy looking at for the NBA for the women’s game.
Sadly, many of my main go-to sites like basketball-reference.com, bball-index.com, backpicks.com, and nbashotcharts.com do not have great all-in-one (“AIO”) metrics or things on a similar scale to the NBA’s metrics for the WNBA. The good folks over at Positive Residual have a pretty solid WNBA AIO called Estimated Contributions (“EC”) which is a box-score informed adjusted plus-minus metric in the vein of ESPN’s Real Plus-Minus (“RPM”), dunksandthrees.com‘s Estimated Plus-Minus (“EPM”), and BBall-Index’s (“LEBRON”) metrics. In my own eyeballing of EC, however, it seems to pretty heavily index on team results and the scale seems to me overly compressed, which makes sense given its use of play-by-play on-off data and the W’s much smaller 36 regular season game sample size relative to the NBA’s 82 game slate.
I should note that Basketball Reference does have Player Efficiency Rating (“PER”) and Win Shares (“WS”) as available AIO metrics for the W, but it is fairly well known that those two metrics leave things to be desired. PER over-indexes on usage at the expense of, ironically, efficiency, while not accounting much for defense. WS over-index on scoring efficiency without properly considering usage rate — a proxy for shot difficulty — and team defense. If those foibles sound like they’re potentially complementary to you, congratulations, you’re correct! More on that in a minute. My favorite (and probably yours too, if you’re reading this) pure boxscore AIO metric for the NBA is Box Plus-Minus (“BPM”). If you’re unfamiliar with BPM, I’ll let its creator, Daniel Myers, speak for himself here, in describing the metric:
Box Plus/Minus, Version 2.0 (BPM) is a basketball box score-based metric that estimates a basketball player’s contribution to the team when that player is on the court. It is based only on the information in the traditional basketball box score–no play-by-play data or non-traditional box score data (like dunks or deflections) are included.
BPM uses a player’s box score information, position, and the team’s overall performance to estimate the player’s contribution in points above league average per 100 possessions played. BPM does not take into account playing time — it is purely a rate stat! Playing time is included in Value Over Replacement Player (VORP) which is discussed below.
League average is defined as 0.0, meaning 0 points above average or below average. Because above-average players play more minutes, there are far more below-average players than above-average players in the league at any time. A value of +5.0 means the team is 5 points per 100 possessions better with the player on the floor than with average production from another player. (In the 2018-19 season, teams averaged around 100 possessions per 48 minute game.)
https://www.basketball-reference.com/about/bpm2.html
Daniel created BPM using a regression of box score stats and position against adjusted plus-minus data to get properly weighted values for each component. I didn’t have access to pure adjusted plus-minus data for the WNBA and I didn’t feel like spending the time to , so in order to work around that and to create something easy to calculate I ran a regression on NBA BPM data using just three variables. Those variables were numerical position (where C = 5, PG = 1, etc.) which made sense as position was included in Daniel’s BPM calculation and the two flawed but okay AIO’s that already existed on Basketball Reference, PER and WS. (In order to scale PER and Win Shares to make sense on a BPM level scale I subtracted league average PER (15) from PER and league average WS per 48 minutes (.100) from a player’s WS/48.)
The result of my regression on the training set of 80% of player seasons selected from every season in the NBA with BPM, PER, and WS data was as follows:
1.07+.285*(PER-15)+26.7*(WS per 48-.100)-.426*(numeric position)
The r-squared for this regression on the testing set was .84 with a mean average error (“MAE”) of only .92 points per 100 possessions on the BPM scale. So it is a very strong proxy for actual BPM, with very simple inputs and is generally very close to the real deal. Here is what that looks like in a plot of the predicted versus actual data points on the training set.
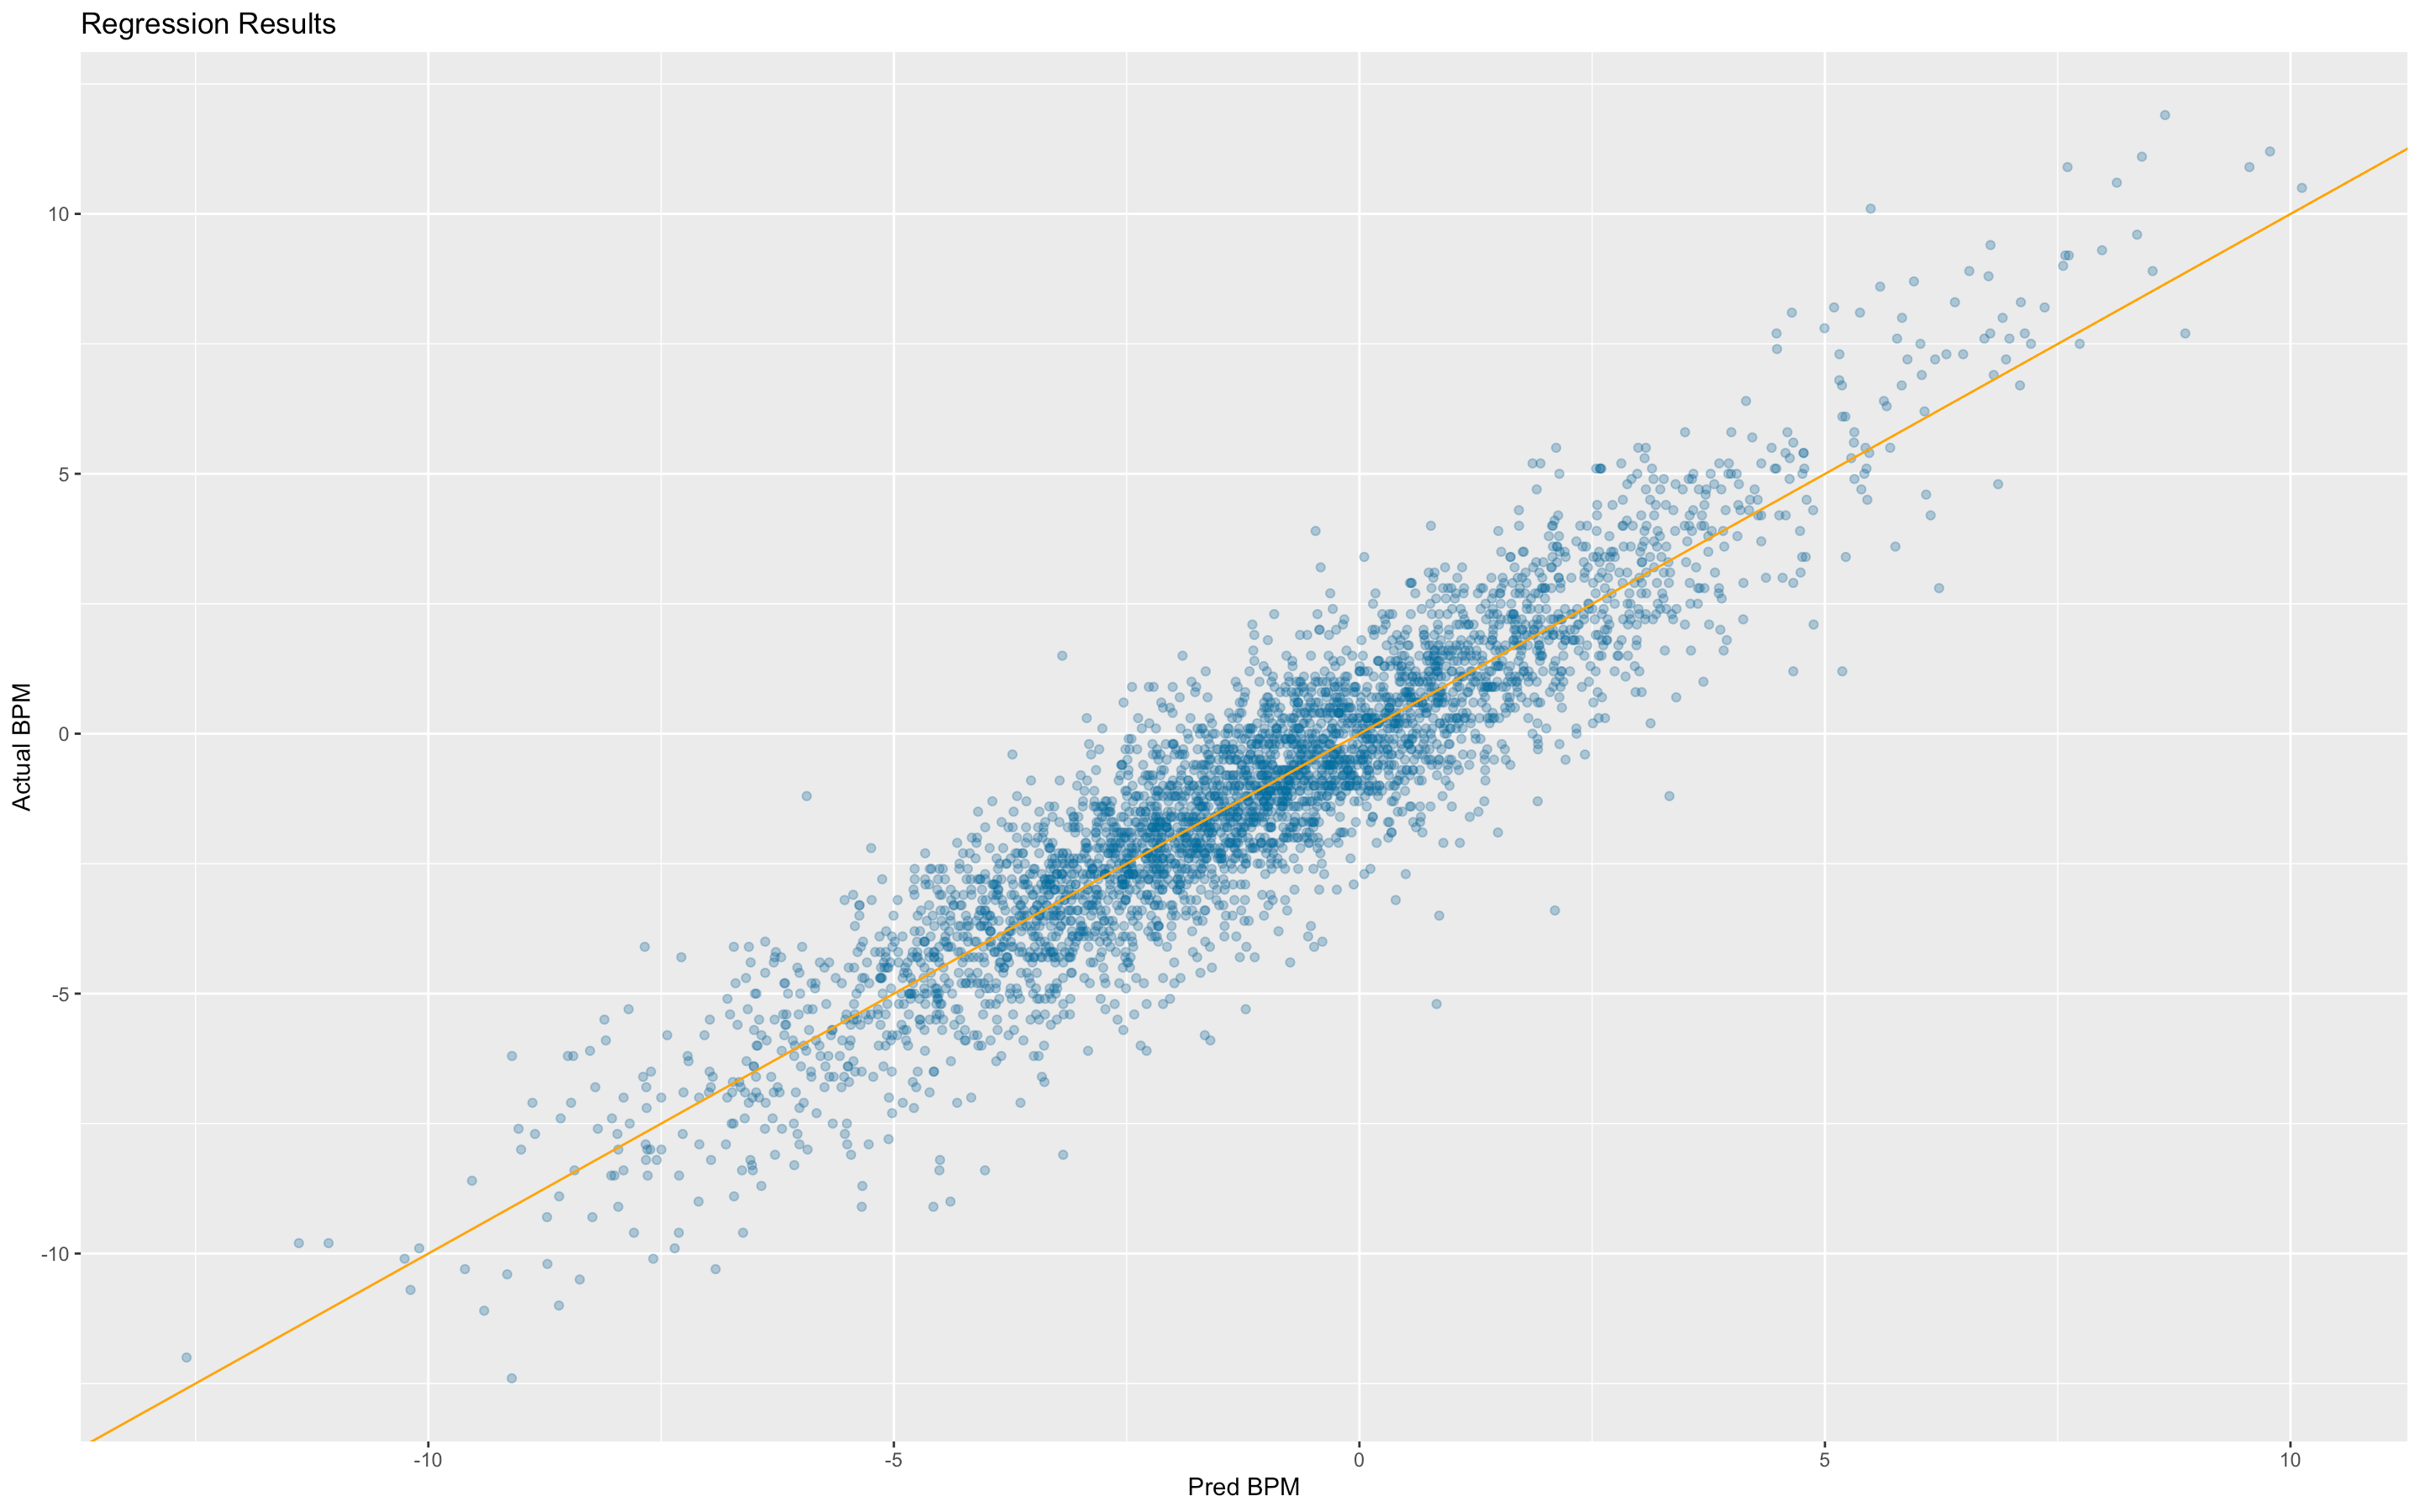
It should also be noted that while both BPM and WS contain a team adjustment to scale production to team strength, PER contains no such adjustment, so it seems clear that the correlation for this predicted BPM would be even stronger once a similar team adjustment was made to scale predicted BPM to team results.
My next step was to take these calculations and apply the same scaling to WNBA PER and WS/40 to produce WNBA BPM. (The W plays 40 minute games so the league average WS/40 is .100 just like it was for the NBA WS/48, since .100 wins * 5 players on the floor equals .5 wins per 40 or 48 minutes, or roughly the length of a game, which is roughly an average.) After getting the raw calculations done, I mean regressed the results using 189 minutes of play at a -0.88 BPM level (ht: Krishna Narsu) to deal with outlier performances from low minute players in either direction, and then applied the team adjustment, which is as follows:
(1.2*NetRtgAdj-sum(player contribution))/5
where NetRtgAdj is Simple Rating System (“SRS”), a/k/a Margin of Victory per Game (“MOV”) + Strength of Schedule (“SOS”), scaled from a per game measure to per 100 team possessions. Player contribution is just (mean-regressed, raw BPM)*(% of team minutes played by player). The reason the team adjustment is set such that player contributions sum up to 120% of actual team strength is to normalize the environment to something like a league average team, because teams that are very good or very bad have a well documented and linear tendency to “rubber band” by either performing below their actual talent or above their actual talent, due to either their or their opponents’ effort changing based on being ahead by a lot, respectively.
Finally, these BPM numbers can be translated into Wins numbers by using the Wins Created method that Nathan Walker developed for any per-100 impact style metric, which goes as follows:
Team Games*(norm.dist(BPM*(% of team minutes played),0,12.5,1)-0.5+0.5*.2*(% of team minutes played))
That looks like a lot, but the logic of it is fairly simple:
BPM*(% of team minutes played) is a player’s contribution to the scoring margin for the team over the whole year, and the normal distribution can be used to estimate a player’s win%, using a standard deviation of 12.5, with the mean of 0. Then we back out an average winning percentage (-0.5) to get the player’s impact to an average team. Then we add back in the impact that an average player would have had in the same number of minutes as the player played (0.5*0.2*(% of team minutes played)) to finally arrive at the number of wins this player could have been expected to add to an average team.
The results of all of these calculations (as well as some metrics I calculated from the excellent Backpicks.com for the WNBA) can be found in the following Google Sheet:
I hope this was informative and someone finds this useful. Enjoy!

1 Comment