
There are some things, as fans, you’d think would be immutable in terms of the data we have on basketball, especially at the NBA level. One of area you might expect to be immutable is the location or zone where shots are taken. A layup is a layup, a mid-range jumper is a mid-range jumper, etc. If you believe that, then you, like me up until a few weeks ago, have not dug in deep enough to the NBA’s shot location data.
It turns out that a restricted area shot is not always a restricted area shot and a mid-range jumper is not always a mid-range jumper. This is because shot location data is tracked by the home scorekeepers in each arena in the league and as such, it is subject to the bias of those scorekeepers. This is similar to another area of scorekeeping, the tallying of assists, which is a process that introduces a great deal of subjectivity to the process. Fortunately, adjusting for scorekeeper subjectivity is a somewhat solved problem, thanks to Jack Moore from Deadspin (not to be confused with the zombie Scabspin that currently operates at that url). Here is a link to Moore’s article detailing the process of adjusting assist numbers for scorekeeping bias or developing “Court Factors” as he called it (borrowing the concept of Park Factors from Sabermetrics).
Court Factors, as with Park Factors in baseball, are an attempt to adjust for differences in the environment that produce statistics. In baseball, the parks have different dimensions and additional weirdness (The Green Monster in Boston, for instance) which can produce these sorts of differences. In basketball, most of the differences in statistical environment come down to scorekeeping bias, hence the example of assists.
Jack Moore’s basic formula for Court Factors as applied to assists is as follows:
We can apply a similar concept to adjust the shot location distribution for each bucket. As an example, here is what such a calculation looks like for a Restricted Area Court Factor:
RA CF = 100*(((Home_RA_FGA+OppHome_RA_FGA)/(Home_Total_FGA+OppHome_Total_FGA)) / ((Road_RA_FGA+OppRoad_RA_FGA)/(Road_Total_FGA+OppRoad_Total_FGA)))
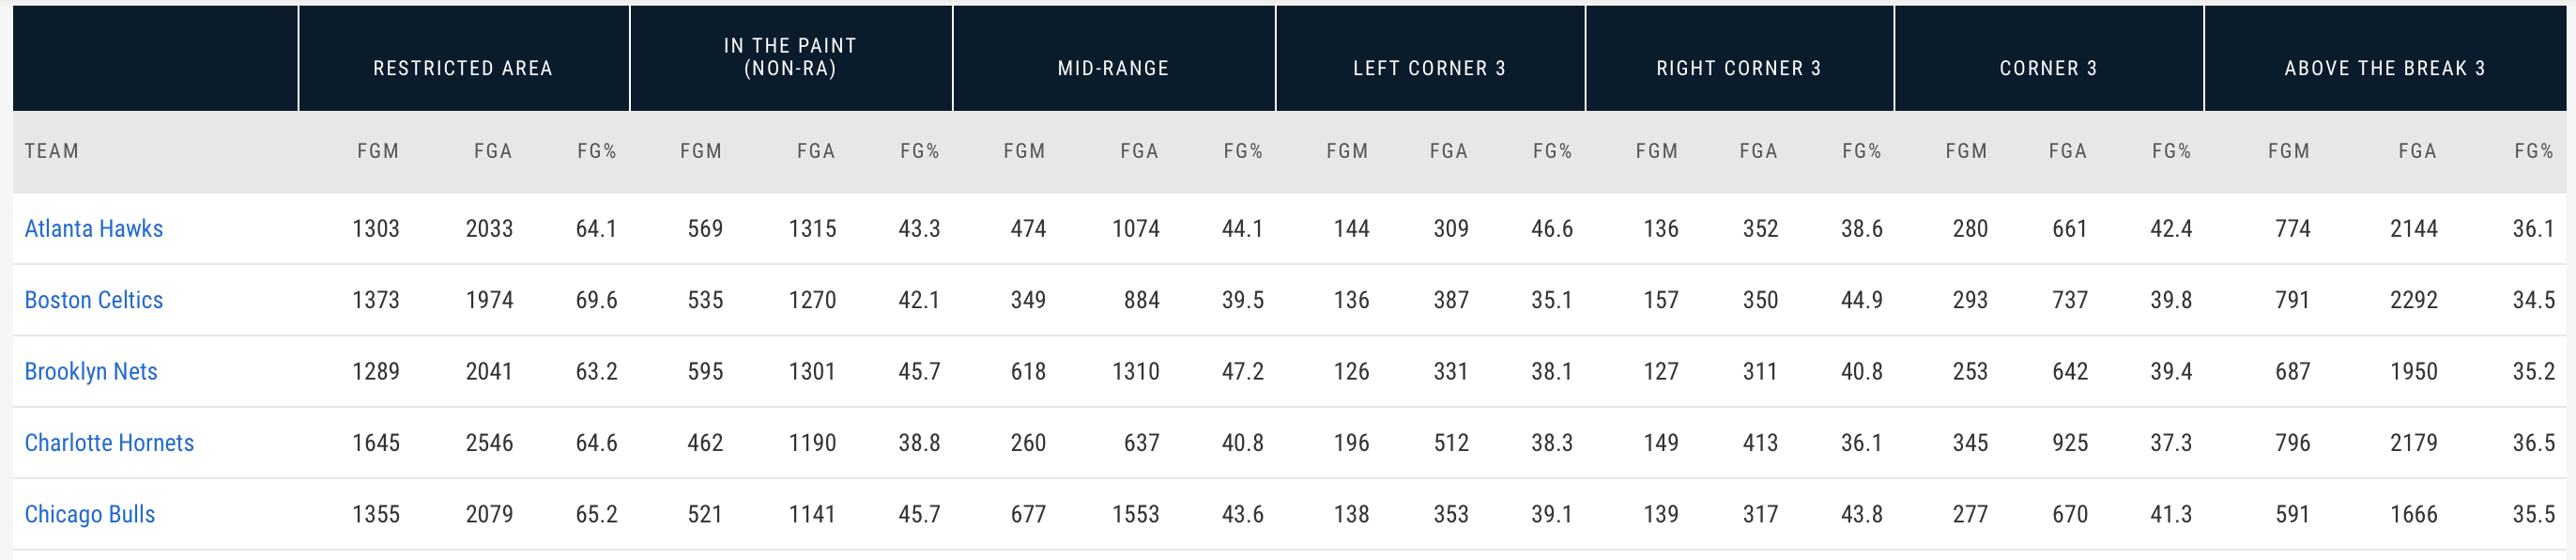
We can then run this for each shot location area and get the Court Factors for each shot location bucket for each arena (shown below).
In order to understand what these numbers represent, a lower Court Factor means that the scorekeepers at that arena are less likely to categorize a given shot into that shot location bucket, while a larger number means the opposite.
As we can see, the Golden State Warriors and Oklahoma City Thunder scorekeepers are the biggest culprits in terms of undercounting restricted area attempts and, as a result, overcounting in the paint, non-restricted area attempts.
Note: RA = Restricted Area, PNRA = Paint Non-Restricted Area, MR = Mid-range, C3 = Corner 3, ATB = Above the Break 3, and CF = Court Factor
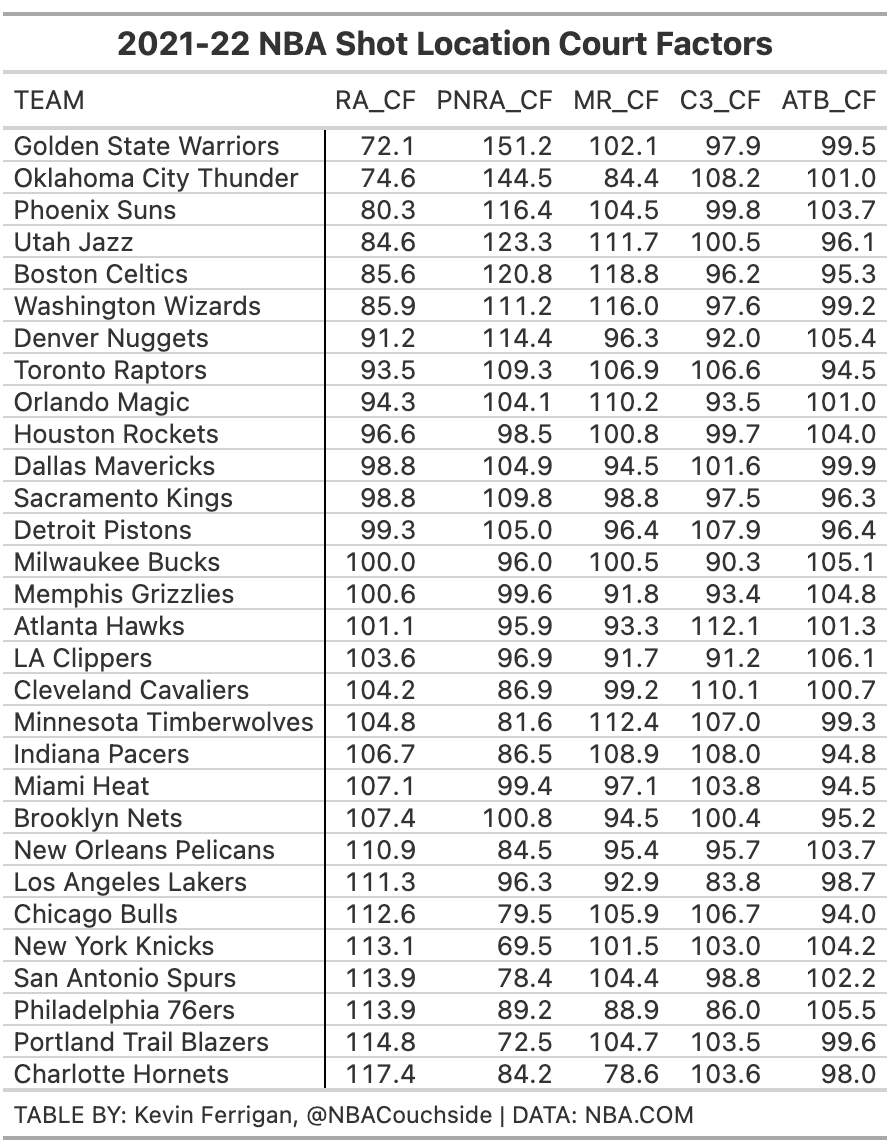
A possible update to this methodology might be to use two point attempts as the denominator in our formula for restricted area, paint non-RA, and mid-range attempts and then use three point attempts as the denominator in our formula for corner 3 and above the break 3 attempts. This makes sense as we should have more confidence in the refs getting it correct as to whether a shot was a two or three point attempt. As a result, we’d see more accuracy in terms of where the bucketing errors occur, e.g. missing restricted area attempts should generally come from paint non-restricted area attempts, unless the scorekeepers are just wildly off. Likewise, missing corner 3 attempts should come from the above the break 3 bucket and vice versa.
Here’s what those results look like:
As you can see, the results are largely the same. Of note in the three point category are the Chicago, Detroit, Cleveland, and Indiana scorekeepers all erring on the side of bucketing 3 point attempts into corner 3s, rather than above the break 3s. Must be a Central Division thing (ignore the Bucks!).
One caveat here that must be said is that it’s possible that some of these differences in bucketing are the result of genuine play style differences between being home and away for the given teams. The Bucks jump out as being a team that might just allow many fewer corner 3s at home versus on the road, given their well known strategy of conceding above the break threes over corner 3s or rim attempts. It’s possible they executed much better at home on that strategy.
Still, these results are significant enough (in particular the restricted area and non-RA paint categories) that its probably wise to consider adjusting for these factors, whether mentally or programmatically, when you’re comparing shot zone data from the league across different arenas.
