
It’s been a while since I’ve written anything in this space, but I’ve not forgotten it, and I’ve not stopped tinkering with some of the ideas I’ve tried to tackle here before. The idea I’d like to return to today is my enjoyment of simple, easy to calculate, transparent boxscore metrics.
In the past, I built off of an easy to calculate and understand linear weights metric (Alternate Win Score) to create Usage Adjusted Rating, which essentially tried to adjust AWS to credit heavier usage players for the greater degree of difficulty they generally encounter in getting points and remaining efficient. The results were pretty good and passed the laugh test. But calculating UAR and the subsequent variant blend with plus-minus (UARPM) that I developed was best done on season long numbers and well, there are much better one number metrics out there for analysis of season long data. Daniel Myer’s Box Plus-Minus (BPM) and ESPN’s Real Plus-Minus (RPM) being the best examples. So from here on, I’ll be retiring UARPM from the website.
But for broad strokes analysis of single games, the current best linear weights metric is probably Alternate Win Score. Some people like to use John Hollinger’s Game Score, since it’s readily available on Basketball Reference for every game. I wanted to improve upon AWS and Game Score and build a transparent, easy to calculate and understand metric to quickly analyze game to game performance.
To build my game score metric, I looked to Jerry Engelmann’s 14 year RAPM data set, since it is, to my mind, the best estimate of long run +/- impact that’s in the public domain. After that, I ran a regression of the most basic boxscore stats (per 100 possessions) to get the coefficients or weights for my simple linear weights metric.
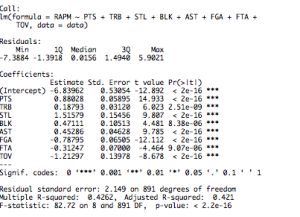
I tried to include personal fouls, but they were not statistically significant predictors of RAPM (+/-) at all. All of the other boxscore stats I picked were highly statistically significant with strong p-values. Then, I translated the coefficients so that they were weighted relative to points score (i.e., so that the coefficient or weight for points was equal to 1). The resulting weights for my simple game score metric are as follows:
PTs + .2*TRBs + 1.7* STLs + .535*BLKs + .5*ASTs — .9*FGA — .35*FTA — 1.4*TOV
If you want to translate this linear weights metric directly to a simple statistical plus-minus, you can just subtract the average performance league-wide from the player’s total. Per pace adjusted 36 minutes the average performance in the league currently is roughly 4.9. Here’s the top 25 in the league as of the games played January 16 per game, pace adjusted, with the per-minute average subtracted out, so as to make it roughly +/- impact per game:
PlayersPM/GAnthony Davis7.1Stephen Curry5.9Chris Paul5.7James Harden5.0Kevin Durant4.3Jeff Teague3.9Jimmy Butler3.8LeBron James3.7Kyle Lowry3.5Damian Lillard3.3Russell Westbrook3.1DeAndre Jordan2.9Tyson Chandler2.8Brandan Wright2.6Kawhi Leonard2.6Kevin Martin2.6John Wall2.6Mike Conley2.5Klay Thompson2.4Paul Millsap2.3Marc Gasol2.3Hassan Whiteside2.3Derrick Favors2.2Kyrie Irving2.1Kyle Korver2.1
Those results definitely pass the laugh test. Anyway, I like this as another tool in the tool kit. I even won over noted one number metric skeptic Seth Partnow to use the metric for some broad strokes performance analysis.
https://twitter.com/SethPartnow/status/555458033006804992
Good enough for me!
If any of you have a good idea for a name for this new Win / Game Score linear weights metric, let me know in the comments or on Twitter: @NBACouchside.
