An expanded explanation of the motivations for and the methodology behind my simple linear weights metric, dubbed “Daily RAPM Estimate” or “DRE.”
http://nyloncalculus.com/2015/02/23/introducing-dre-a-hopefully-better-simple-metric/

Thoughts on the Association from my couch
An expanded explanation of the motivations for and the methodology behind my simple linear weights metric, dubbed “Daily RAPM Estimate” or “DRE.”
http://nyloncalculus.com/2015/02/23/introducing-dre-a-hopefully-better-simple-metric/
It’s been a while since I’ve written anything in this space, but I’ve not forgotten it, and I’ve not stopped tinkering with some of the ideas I’ve tried to tackle here before. The idea I’d like to return to today is my enjoyment of simple, easy to calculate, transparent boxscore metrics.
In the past, I built off of an easy to calculate and understand linear weights metric (Alternate Win Score) to create Usage Adjusted Rating, which essentially tried to adjust AWS to credit heavier usage players for the greater degree of difficulty they generally encounter in getting points and remaining efficient. The results were pretty good and passed the laugh test. But calculating UAR and the subsequent variant blend with plus-minus (UARPM) that I developed was best done on season long numbers and well, there are much better one number metrics out there for analysis of season long data. Daniel Myer’s Box Plus-Minus (BPM) and ESPN’s Real Plus-Minus (RPM) being the best examples. So from here on, I’ll be retiring UARPM from the website.
But for broad strokes analysis of single games, the current best linear weights metric is probably Alternate Win Score. Some people like to use John Hollinger’s Game Score, since it’s readily available on Basketball Reference for every game. I wanted to improve upon AWS and Game Score and build a transparent, easy to calculate and understand metric to quickly analyze game to game performance.
To build my game score metric, I looked to Jerry Engelmann’s 14 year RAPM data set, since it is, to my mind, the best estimate of long run +/- impact that’s in the public domain. After that, I ran a regression of the most basic boxscore stats (per 100 possessions) to get the coefficients or weights for my simple linear weights metric.
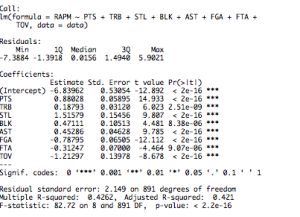
I tried to include personal fouls, but they were not statistically significant predictors of RAPM (+/-) at all. All of the other boxscore stats I picked were highly statistically significant with strong p-values. Then, I translated the coefficients so that they were weighted relative to points score (i.e., so that the coefficient or weight for points was equal to 1). The resulting weights for my simple game score metric are as follows:
PTs + .2*TRBs + 1.7* STLs + .535*BLKs + .5*ASTs — .9*FGA — .35*FTA — 1.4*TOV
If you want to translate this linear weights metric directly to a simple statistical plus-minus, you can just subtract the average performance league-wide from the player’s total. Per pace adjusted 36 minutes the average performance in the league currently is roughly 4.9. Here’s the top 25 in the league as of the games played January 16 per game, pace adjusted, with the per-minute average subtracted out, so as to make it roughly +/- impact per game:
PlayersPM/GAnthony Davis7.1Stephen Curry5.9Chris Paul5.7James Harden5.0Kevin Durant4.3Jeff Teague3.9Jimmy Butler3.8LeBron James3.7Kyle Lowry3.5Damian Lillard3.3Russell Westbrook3.1DeAndre Jordan2.9Tyson Chandler2.8Brandan Wright2.6Kawhi Leonard2.6Kevin Martin2.6John Wall2.6Mike Conley2.5Klay Thompson2.4Paul Millsap2.3Marc Gasol2.3Hassan Whiteside2.3Derrick Favors2.2Kyrie Irving2.1Kyle Korver2.1
Those results definitely pass the laugh test. Anyway, I like this as another tool in the tool kit. I even won over noted one number metric skeptic Seth Partnow to use the metric for some broad strokes performance analysis.
https://twitter.com/SethPartnow/status/555458033006804992
Good enough for me!
If any of you have a good idea for a name for this new Win / Game Score linear weights metric, let me know in the comments or on Twitter: @NBACouchside.
Let me get this out of the way at the start: I love Mike Dunleavy Jr. He’s really, really good. You should love Mike Dunleavy Jr., too. Here’s why:
More at: http://www.blogabull.com/2014/11/19/7246255/in-praise-of-mike-dunleavy-jr
Through 4 games, Tom Thibodeau’s defense is outside of the league’s top 10 in points allowed per 100 possessions and that is, obviously, very surprising. Granted, Chicago is 11th in defensive efficiency, so they are barely outside of the top 10, but given that under Thibodeau the Bulls have finished 1st, 1st, 5th, and 2nd in overall defense in the last 4 seasons, it is a bit surprising to see them anywhere but the very tip top of the league’s defensive rankings, even at this early juncture.
More at: http://www.blogabull.com/2014/11/6/7162997/the-bulls-strange-inability-to-defensive-rebound
Like Andrew Johnson, I did some season projectin’ for the season starting tonight. The basic method was to take ESPN’s Real Plus-Minus (RPM) numbers and run them through a simple aging curve and then to project out the season minutes.
…
Read more here: http://nyloncalculus.com/2014/10/28/more-2014-2015-nba-season-win-projections/
Last post, I mentioned that Kevin Durant was the UARPM100 MVP, and I gave a top 10 list of players in Wins Above Replacement as well. After looking through the numbers, something that occurred to me was that the number of total wins under those numbers didn’t sum up to team level wins. That was primarily an effect of including raw per minute plus-minus numbers as part of the UARPM formulation. Basically, good teams had too many wins, and poor teams had too few wins. So I decided to correct that. I adjusted the UARPM100 numbers using a per minute adjustment for each player on the team so that total team plus-minus was equal to team SRS (basically point differential adjusted for strength of schedule) via Basketball-Reference. The final numbers are posted on the UARPM100 page.
The top 10 is basically the same, with Carmelo Anthony jumping into the 8th spot, and DeAndre Jordan sliding to 10th. The total number of wins are reduced across the board, and they are no longer set to above replacement, because I decided it’d be more interesting to just have total wins contributed. You can easily turn wins into Wins per 48 minutes by dividing by minutes played and multiplying by 48. Durant and LeBron were nearly exactly the same in per possession impact by UARPM100, with Durant’s heavier minutes load giving him the edge in wins. Chris Paul also remains the best per-possession player in the league, even after the team adjustment.
Here’s the updated top 20:
RankPlayersMINUARPM100Wins1Kevin Durant31226.720.02LeBron James29026.718.63Kevin Love27966.417.64Stephen Curry28466.117.35Blake Griffin28635.215.86Chris Paul21717.214.77Joakim Noah28204.614.38Carmelo Anthony29824.114.39James Harden27774.514.110DeAndre Jordan28704.213.911Paul George28984.113.912DeMarcus Cousins22985.913.713John Wall29803.513.114LaMarcus Aldridge24994.713.015Kyle Lowry28623.512.616Dwight Howard23964.612.217Goran Dragic26683.611.918Anthony Davis23584.411.719Al Jefferson25533.811.720Serge Ibaka26663.411.6
All in all, this seems like a pretty credible list. For what it’s worth, Rookie of the Year award winner, Michael Carter-Williams produced 6.1 wins under UARPM100, well ahead of runner-up Victor Oladipo who clocked in at 4.7 wins. The voters appear to be doing a pretty good job.
I recently updated my UARPM100 numbers to reflect the end of regular season statistics. You can see the final numbers here. After all the games were played, Kevin Durant was the UARPM100 MVP in my version of Wins Above Replacement (WAR). Durantula provided roughly 21.8 wins over what we’d expect from a replacement level player taking over his minutes, while LeBron James came in as a close second providing 21.5 WAR. LeBron was a bit more productive per possession, by UARPM100, than Durant (+7.6 to +7.1), but Durant played more minutes, which ultimately made the difference.
Interestingly, Chris Paul was tops in per possession productivity clocking in at +8.1 points per 100 possessions better than average. CP3 missed a number of games with injury, which knocked him out of MVP consideration. Paul was still able to contribute 16.8 WAR despite only playing 61 games, which is pretty amazing.
The top 10 in WAR via UARPM100 were:
1. Kevin Durant, 21.8 WAR
2. LeBron, 21.5 WAR
3. Kevin Love, 19.4 WAR
4. Stephen Curry, 18.9 WAR
5. Blake Griffin, 18.2 WAR
6. Chris Paul, 16.8 WAR
7. Joakim Noah, 16.1 WAR
8. DeAndre Jordan, 16.0 WAR
9. James Harden, 15.7 WAR
10. Carmelo Anthony, 15.1 WAR
(Way to waste a really great season from Carmelo, Knicks.)
Also notable: Goran Dragic, who recently received the NBA’s Most Improved Player award, finished 20th overall in WAR. In 2012–13, Dragic put up a +1.3 UARPM100, while this season he put up a +3.8, along with the aforementioned 20th place finish in WAR. A pretty big leap, and one of the more difficult things a player can do- go from being the pretty good player he’s been his whole career- to jumping into the top echelon.
In my last post, I mentioned that I would, from time to time, produce UARPM100 numbers that were prior-informed by xRAPM numbers from Stats for the NBA. Today, after roughly 30 games played for each team, I’ve gone ahead and produced those numbers. Enjoy!
Last time out I explained, in detail, how I calculate Usage Adjusted Rating (a usage adjusted version of Alternate Win Score). I liked the results, but I thought that they could be better. In order to try to better value defense, I decided to try to include a weight to factor in minutes per game played. I made this decision based on the idea that coaches, generally, won’t play someone a lot of minutes if he’s got shaky counting stats- which basic UAR covers- unless he’s providing other value. So I added a factor that gives a slight boost to players who play 20 minutes or more per game and gives a slight negative to players who play under 20 minutes a game.
In addition, I took the UAR with the minutes per game adjustment (70%) and blended it with non-adjusted +/- per pace adjusted 48 minutes (20)% and added a zero-weight to regress it to the mean (10%), as this was the blend that best correlated with xRAPM. Then I made the metric 100 possessions, instead of per 48 minutes pace adjusted. I call this new metric UARPM100, which is a bit of a mouthful, but it conveys the information contained within the metric, so I’m sticking with it.
I ran a correlation of UARPM100 over past years against xRAPM from Jeremias Englemann at stats-for-the-nba.appspot.com. The r-squared for UARPM100 against xRAPM was roughly .67. The r-squared becomes much, much stronger if prior year xRAPM is blended with UARPM100. The r-squared for blended prior year xRAPM and UARPM100 is roughly .82 with in-year xRAPM, which is obviously very strong. Given my belief that xRAPM is probably the best one-number metric in the public domain, I feel pretty good about UARPM100’s results. Here are the results for UARPM100 through the December 16, 2013 games (minimum 120 minutes played):
Going forward, I will be updating UARPM100 as close to daily as possible. Periodically, I will also post UARPM100 that’s prior informed by 2012–13 xRAPM. Hope you enjoy!
Usage Adjusted Rating, as I discussed previously, has Alternate Win Score (AWS) as its base. Alternate Win Score is a simple per minute measure of performance, which has proven to be the best linear weights metric for prediction across high continuity and low continuity contexts. High continuity contexts are situations where a team is the largely the same as it had been when the players compiled the statistics being used to make predictions. Low continuity contexts are the opposite. AWS, as Neil Paine has demonstrated, is the best linear weights metric for prediction when dealing with both of those situations. So how is Alternate Win Score defined?
AWS equals Points+0.7*(Offensive Rebounds)+0.3*(Defensive Rebounds)+Steals+0.5*(Blocks)+0.5*(Assists)-0.7*(FG missed)-(FG made)-0.35*(Free Throws Missed)-0.5*(Free Throws Made)-Turnovers -0.5*(Fouls Committed) all divided by Minutes Played.
I wanted to make some tweaks to this basic formula. Namely, I wanted to include a usage-efficiency tradeoff. As I mentioned in the previous post, APBRmetrics forum poster v-zero provided a way to do that. I incorporated his math into the formula for AWS and after some tweaking, I arrived at UAR.
About that tweaking. Some people have expressed interest in knowing exactly how I arrived at the numbers I came up with. So here goes. I broke AWS into two separate figures. The scoring (and offensive turnover) portion and the Non-Scoring aspect. The Non-Scoring portion of UAR simply is equal to .7*OREB+.3*DREB+Steals+.5*Blocks+.5*Assists-.5*Fouls Committed per pace adjusted 48 minutes.
Then I moved on to the Scoring portion of UAR, which includes turnovers because turnovers use a possession just the same as a shot attempt or free throw attempts, except turnovers obviously always result in 0 points. I calculated the league average for points per possession (PPP), using the simple formula for possessions (FGA+.44*FTA+TOV), and similarly calculated the league average for possessions per 48 minutes (USGper48), again using the simple possession definition. I then used the coefficients v-zero provided to create what I call average ScoreRating, which is simply 5*(PPP)+.076*(USGper48). For this season, thus far, the league average for that number has been roughly 6.2. Next I calculated the Score Rating for every player in the league and subtracted out the league average rate, so that if you’re an average scorer you break-even in Score Rating, if you’re above average you contribute a positive value through your combined scoring volume and efficiency whereas if you’re below average, you detract value from your team through your inability to score. I also had to multiply Score Rating by a coefficient in order to properly value scoring in UAR relative to the NonScoring parts of UAR. The Scoring Rating needed to be worth roughly 2.7 times the Non-Scoring Rating, based on some math resulting from the Four Factor weights discovered by Evan Zamir here. In order to get the scale right, the coefficient turned out to be roughly 2.4. This owed to the league average for Score Rating being 6.2 and the league average for Non-Score Rating being about 5.5. Then I set total league average UAR to 0.
These numbers change year over year but they are pretty consistently in this range. I then added the Scoring and Non-Scoring parts together to get UAR. The equation for this year basically looks like this:
UAR = (2.4*(5*(PPP)+.076(USGper48))+ (7*OREB+.3*DREB+Steals+.5*Blocks+.5*Assists-.5*Fouls Committed per pace adjusted 48 minutes)-((lg avg Score Rating)+(lg avg non-score Rating))
The numbers, as I said, vary year over year depending on what the average numbers league wide are.
