
I really like advanced basketball stats and trying to learn as much as I can about them. As a result, I spend an inordinate amount of time perusing the threads over on the Association for Professional Basketball Research (APBR) message board. Through my reading there and elsewhere (usually following links I found there), I have come into contact with a statistic called regularized adjusted plus-minus or RAPM for short.
Adjusted plus-minus is essentially an approach that attempts to use on / off data to determine how much a given player contributes to the margin of victory (or loss as the case may be). It does this through regressions on lineup data found in play-by-plays to determine the +/- of a given lineup over a given shift that they were out there. The regressions then spit out numbers which show how much a player is likely worth + or — per 100 possessions. The problem with adjusted plus-minus in its regular form is that is quite noisy and that there are collinearity issues. Collinearity, in this context, just means that there are often players who play together a lot and thus it is hard to disentangle their value in +/- from one another. Additionally, the sample sizes of minutes played by each lineup are small, which leads to the aforementioned noisiness in the data.
RAPM improves upon the regression-based approach of standard adjusted plus-minus by using a technique called regularization or ridge regression. It’s basically a high level math technique that statisticians use to deal with the problems presented by the normal adjusted plus-minus type of regressions. It leads to much less noisy, more accurate results.
Finally, xRAPM, the subject of this post, includes a box-score based statistical prior to further inform the player ratings and thus improve the predictive effectiveness of the metric. All of this is a long-winded way of saying that xRAPM is the most accurate +/- metric that exists for predicting future results of which I’m currently aware. As a result, it’s the method that I will use to project each of the 30 teams’ records in the NBA next year, based on estimated minutes, and impact of the players on each team. The numbers for xRAPM are available here. (Thanks to Jeremias Engelmann for publicly providing the data).
xRAPM is a great tool for projecting, but I wanted to translate it to something more tangible to the common fan. Wins. After talking to Nathan Walker of the Basketball Distribution on Twitter, I learned a way to convert xRAPM into WARP (wins above replacement player). In short, xWARP (for short) examines the number of wins a player contributed over what an available replacement would provide in the same number of minutes. I set replacement level at a xRAPM of -2.5 points per 100 possessions in xRAPM. Nathan uses -3.5, according to our Twitter conversation, but the end result of projecting is the same.
Now, for the true purpose of this post. I will be examining every team in the league by looking at their xWARP for this past season and trying to project their xWARP following their offseason moves. I’m starting with the Central Division and the Chicago Bulls, because they’re my favorite team, I know them best (and can best guess minutes distributions), and because their offseason is more or less done (save a cheap big man or guard signing, which are likely to be replacement level players themselves, so have basically no impact on this math).
The Bulls this year were a team that outperformed their point margin by about 3 wins. Their MOV was a relatively small +.32. Subbing that into the standard MOV to wins converter equation from The City’s Advanced Stats Primer ( 2.54*MOV+41 = wins), the Bulls should have won about 41.8 games, so basically 42 wins. Instead, the Bulls were statistically lucky. They won 3 more games above their expected win total. A lot of that probably had to do with Marco Belinelli’s 3 ridiculous game winners. But basically, the Bulls were better than expected based on how close they played their opponents. This was not a 45 win team, it was more like a 42 win team. Here are the numbers:
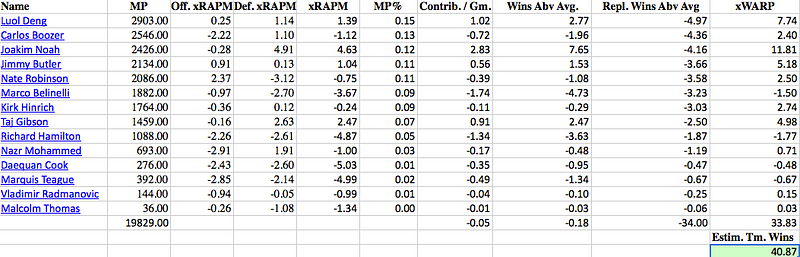
By xWARP the Bulls look more like a 41 win team but the point is roughly the same. They overperformed their expected win performance level based on what amounts statistically to luck.
So the Bulls just signed Mike Dunleavy Jr this year, a good player, and they get their MVP, Derrick Rose back, so surely they will win many more games this year, right? Short answer: yes. But let’s look at the numbers.
I projected the Bulls’ minutes distribution for next year using a combination of a method described here by Kevin Pelton formerly of Basketball Prospectus and currently of ESPN.com Insider, based on a study by basketball statistician Ed Kupfer and my own intuition about how many minutes a player would play per game played based on rotations. Pelton describes the method as setting the expectation for a player starting at 76 games and going down about one game for each six missed the previous season and one for each 20 missed two years ago. Two years ago was a 66 game season, so I used 16 games instead of 20 games when calculating that number of games in the projection. I did two projections. I projected what the Bulls would look like with Derrick Rose playing just 61 out of 82 games (the number according to the Pelton-Kupfer projections) at his usual 36 minutes a game. Then I looked at what they would look like if Rose matched his career high in minutes played of 3026 minutes (a/k/a the scenario where he’s truly 110% in Rose-speak). In the latter scenario, I subtracted Rose’s additional minutes from Kirk Hinrich and Marquis Teague, the back-up point-guards. Here are the results for the less optimistic, (probably) more realistic numbers for Rose playing about 2200 minutes over the season:
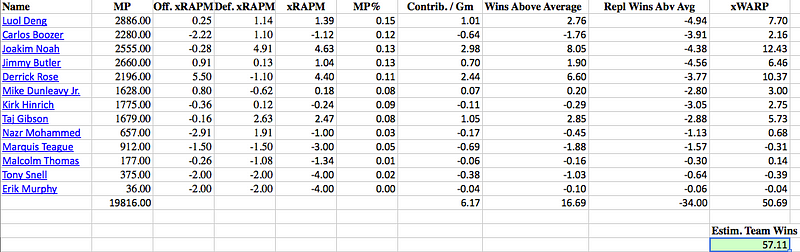
The Bulls here project as … a 57 win team. After not having their MVP for an entire year and winning 45 games (and really being more like a 41–42 win team) a 57 win season with him playing nearly 2200 minutes would be great for Bulls fans and should signal return to the East’s top tier. What about if the Bulls get 110% super-healthy Derrick Rose and he plays 3026 minutes?
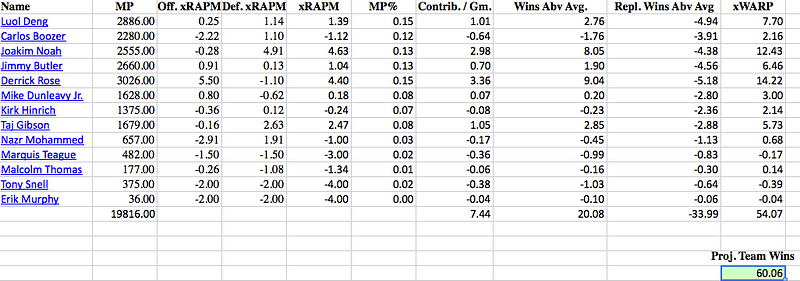
Congratulations Bulls fans! With a very healthy Rose, you’re looking at … a 60 win team! Adding about 800 minutes to Rose’s minutes projection yields an additional 3 wins in xRAPM. Basically, if DRose is back to the level that his old self and able to play 2010–11 level minutes, then the Bulls will look very much like the team that won 62 games that year and 50 out of 66 the following year. Even if Rose is only able to go 61 out of 82 games, the Bulls still look to be a high 50 win team. Of course, there are caveats, in all of this. Luol Deng and Carlos Boozer have both been declining by xRAPM for 3 years in a row. They may further decline. Rose may not be at the level that he was before his injury right away. There could be another major injury to a significant piece of the core group (*fingers crossed, knocking on wood that this doesn’t happen*).
But there are potentialities that would allow the Bulls to look even better. Jimmy Butler improved quite a bit over his rookie xRAPM of -.7 to a solid 1.04 this past year and he’s young enough he should continue to improve. Joakim Noah is still just 28 years old and is in his peak years, so he will likely remain the same or slightly better. Marquis Teague may improve more than I have estimated (I assumed he would be at least a -3 in xRAPM this year, slightly below replacement level still but not as bad as his terribad previous season xRAPM of nearly -5). The new rookies may be better than the -4 xRAPM level that I have pegged them at, just to be safe, and may get more minutes if they outplay the older players, though with Thibs at the helm, I highly doubt the rookies get many minutes, as is clear from my minutes projections. Finally, Derrick Rose may be better than ever. He was on a solid upward trajectory prior to his injury and he’s had a long, long time to improve on his jump shot and other skills. He’s been able to observe and watch for defensive tendencies. Now he’s coming back after taking his time with his recovery and feels 100% right. I’m certainly not going to rule out him possibly ratcheting up another level. I’ve learned not to doubt the man.
After all that dense reading, I leave you with a whole bunch of awesome DRose highlights:
Image from Keith Allison via Flickr
