Projecting the NBA using xWARP: Houston Rockets

That bit I wrote yesterday about the Los Angeles Clippers and Brooklyn Nets having the best offseasons of the summer? Yeah, scratch that one. That was a glaring oversight on my part, because clearly no team in the league had a better offseason than the Houston Rockets, who, after years of tireless searching, finally landed President of Basketball Operations Daryl Morey’s version of Ahab’s White Whale: a top 5 player in the league. That player, Dwight Howard, can be nauseating at times with his desire to play the crack-up, the clown, the immature teen who’s actually a late 20’s man, but the talent and production have never been a question. Howard had jokes all through his time in Orlando, and yet, he was always worthy of consideration as an MVP candidate as he came into his own.

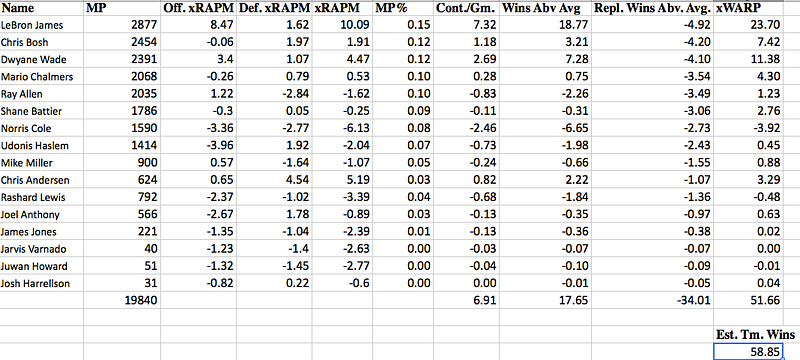
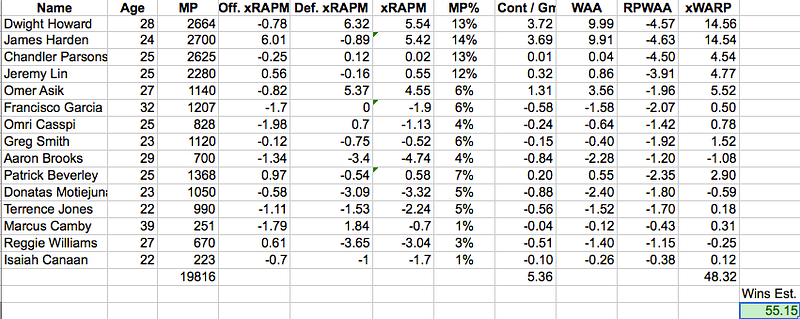
In 2010–11, Howard reached the peak of his powers, leading the league in xRAPM (yes, even ahead of LeBron James); this just two years after Howard dragged this rather rag-tag bunch to the NBA Finals, going through James’ Cavs to do it. That season, which saw Howard working as a top 5 player by xRAPM (and most other metrics you might want to look at), was just the beginning of Howard’s dominance in Orlando, as he finished in the top 2 every year from then on, even including his injured and distracted final run in 2011–12 with the Magic. That last season in Florida, disappointing as it was, paled in comparison to the depths of disappointment Howard’s turn as a Los Angeles Laker inspired. Howard came back from his back surgery too quickly. He became frustrated over trying to fit in with Mike D’Antoni’s offense. He fell off, and to the eyes of many, he stopped trying as hard. For my own part, I believe he was limited mostly by injury and the lack of floor spacing the Lakers supporting cast had on offer to open up lanes for him to roll to the basket off of pick and rolls. He also, stubbornly, insisted on getting touches in the post, despite his dominance as a rolling finisher and his relatively pedestrian skills on the block. He was also clearly unhappy, as he bristled beneath Kobe Bryant’s unflinching iron fist and joyless assassin’s mentality. Even with all of those issues facing him, Dwight was in the league’s top 6 players by xRAPM, coming in with a still very impressive +5.54.

And now? Dwight gets to have fun again. He’ll have his new buddy Chandler Parsons with whom to goof and clown. Morey has made sure that the floor with remain spaced for Howard with bargain priced shooters filling out the wings. Oh, and Dwight will also get to play with James Harden: the league’s best shooting guard, even at his tender age of just 23, and one of the very best pick and roll triggermen in the game. This was the formula for Dwight’s dominance in Orlando, only Harden is so much better than anyone Howard was tasked with playing with in Orlando that it’s scary to wonder just how good these Rockets can be.

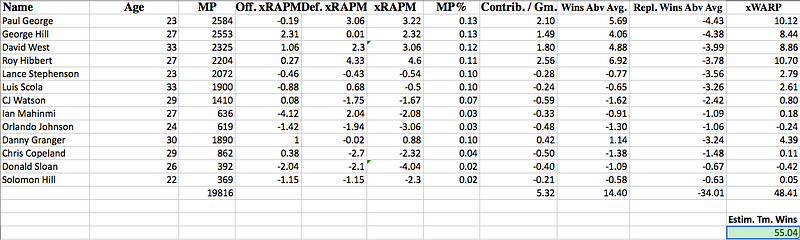
So what do the numbers say? The first projection I ran used Dwight’s performance last year as the baseline. By that measure, the Rockets appear to be a 55 win team.

image

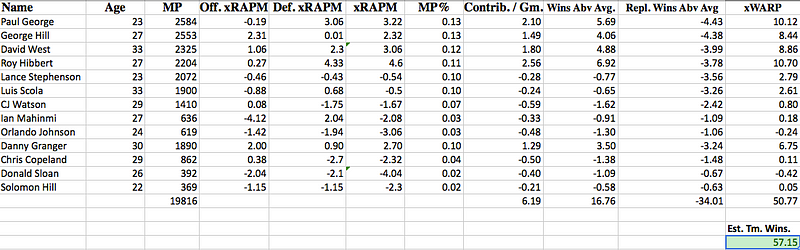
A playoff team, probably worthy of a round of homecourt advantage, even in the stacked Western Conference and a team that could contend for a title, even with a less-than-what-he-once-was Dwight. But what if Superman returns? What if Dwight is really, really back (as I suspect he will be: I think he just needed to get healthy)? Well, then the Rockets start to look a bit like world-beaters.

image

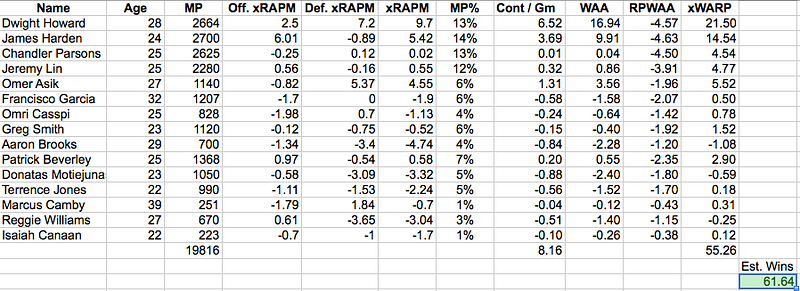
62 wins, with a healthy, Orlando-level Dwight. This is the stuff of Rockets fans’ dreams. It’s not inconceivable, and it might not even be all that unlikely. Fans were right to criticize Howard’s relative lack of effort last year, but moving forward, there’s a lot of reason to believe the effort will return (as will, unfortunately, the terrible jokes), the fit is better, and Howard should be a year healthier. Add it all up, and I think that Superman returns for Houston this year. Maybe Dwight will even get his wish to “be epic.”

Image via flickr user Keith Allison

Update: This post from Brett Koremenos over at Grantland makes the point that the Rockets could potentially play Asik alongside Howard for extended minutes. I only projected Asik to play 15 minutes a night as a result of Dwight’s arrival, but if you bump Asik’s projected minutes up to 25 minutes a game, the Rockets become a 59 win team with last year’s version of Dwight and a 65 (!) win team with the Orlando version of Dwight. I doubt they reach quite that high, if only because Dwight and Asik together on offense would put them in less than optimal roles (spacing issues being the primary problem) which would have a negative effect on their respective offensive xRAPMs. On the other hand, the two of them on defense together would be seemingly almost impossible to score on in the paint.

Projecting the NBA using xWARP: Los Angeles Clippers

So, the Clippers. What an offseason, huh? The Clippers had arguably the best offseason in the league this year, save what Brooklyn was able to cook up 3,000 miles away on the opposite coast. To recap: they were able to acquire two capable wing players (Jared Dudley, J.J. Redick) in exchange for a player (Eric Bledsoe) who, despite his massive potential and above average production, simply didn’t figure to play enough to justify what he’ll need to be paid, because of the top 3 player in the NBA playing in front of him (that’s Chris Paul, you guys). They replaced that potential with the less talented, but still capable Darren Collison, the once and future CP3 understudy. They retained Matt Barnes and drafted another 3 and D wing in Reggie Bullock. They’re flush with those types between Redick, Dudley, and now Bullock. Maybe too much so. But, on the plus side, they acquired Doc Rivers to manage all those wings and fix a rotation that works, for the relatively piddling price of a late first round pick. Oh, Byron Mullens is along for the ride, too, but he’s not very good at much besides taking and missing a lot of jump shots while simultaneously being tall. So, really, who cares about Byron? What do the numbers have to say about what we can expect from the Clippers after their offseason to remember?

image

57 wins. That’s improvement over this year’s 56 wins, but not much. Why don’t the Clippers look better? Well, they lost Eric Bledsoe who, as it turns out, was a +1.61 player in xRAPM and played 1500+ minutes for them last year. Jared Dudley and J.J. Redick had lower xRAPMs than Bledsoe, as did Darren Collison. Additionally, the Clips lost Lamar Odom who was a +.82 xRAPM and replaced his 1600+ minutes with the terrible Byron Mullens and a combination of wings who will likely be worse than Odom was last year, at least by xRAPM. Plus, Jamal Crawford and Matt Barnes project to decline relatively significantly, while Blake Griffin somewhat offsets that with a pretty significant improvement, as he climbs towards his peak years. Subjectively, this prediction seems like it could be a bit low, as the Clips had the MOV of a 59 win team and most NBA heads had them improving this offseason. Plus, Doc Rivers is in a different class as a coach than Vinny Del Negro. But I present the numbers here for you, dear reader, to ponder over.

Sidenote: At the end of all this projectin’ I will try (if I have time) to incorporate the schedules of the teams, the strength in projected MOV of each team, and the value of home court advantage for each team (as determined by Evan Z over at The City) in order to come up with the most accurate predictions that I can. Also, you should check out the ESPN NBA Forecasts, as they are going up over the next few days. Lots of smart people’s thoughts aggregated together = wisdom of crowds = awesome analysis.

Image via flickr user Keith Allison

Projecting the NBA using xWARP: Indiana Pacers

Continuing my series projecting the 2013–14 NBA regular season using xRAPM and minutes projections, today I’ll be discussing the Indiana Pacers.

The Pacers had a very strong starting group last year. According to Basketball-Reference, the Pacers starting five-man unit was fourth in the entire league in Net Points per 100 possessions among lineups that played at least 300 minutes together, clocking in at a sterling +12.1 points per 100 possessions. Over the course of an 82 game season, a +12.1 MOV translates to a roughly 72-win team. The Pacers’ five of George Hill, Lance Stephenson, Paul George, David West, and Roy Hibbert played over 1200 minutes together, ranking them as the second most played 5 man unit in the entire league, trailing only the Oklahoma City Thunder’s starting five of Russell Westbrook, Thabo Sefolosha, Kevin Durant, Serge Ibaka, and Kendrick Perkins. The Thunder’s starting five only managed a (still incredible) +10.7 Net Points per 100 possessions. Basically, the Pacers’ starting five players was arguably the best in the entire league, given the relatively large sample of minutes they played together and their excellence when they were on the floor.

The Pacers’ problem was that their bench was pretty terrible. They gave pretty significant minutes to sub-replacement level players like D.J. Augustin, (-3.68 xRAPM), Gerald Green (-3.21), Orlando Johnson (-3.36), Sam Young (-4.94) and Dominic McGuire (-2.93). Well, this coming year that will no longer be the case. With the exception of Orlando Johnson, all of those guys will not be on the team next year. Instead, they’ve been replaced by C.J. Watson, Chris Copeland, Luis Scola, a returning Danny Granger, Donald Sloan (another below replacement player, but hey, you can’t win them all), and rookie Solomon Hill (who projects to be just above replacement level at -2.3). In addition, Orlando Johnson projects to be better this year, as he progresses upward in his career trajectory, though he’ll still likely be below replacement level. The Pacers starting five has gotten significant reinforcements. How much better will this make the Pacers?

Well, there’s one more thing to worry about and that’s just how good will Danny Granger be when he returns to the floor. I have no way of knowing what Granger will look like in xRAPM should he return healthy. I don’t know if he will be the roughly +1 xRAPM player he was in just 5 games this year or if he will look more like the +2.5–3.0 player he has been over the two years prior. Tendinosis is a scary injury. So, I ran the projections using Granger’s bad numbers from last year and then again with a possession-weighted average of Granger’s last few seasons adjusted for his 30 year old age. Up first, what the Pacers look like with a significantly reduced (like last year) Granger playing about 63 games.

image

Next year, the Pacers with a less-than-peak-effectiveness Granger look like a 55 win team. Given that they won 49 games last year, this might seem like a disappointing improvement considering how much better their bench has gotten this offseason. But a six-win improvement is very significant. That’s a 12% increase in wins. In addition, Paul George’s minutes projection is lower than his actual minutes from this past year by a shade under 400 minutes. So if George is able to play as many minutes as he did last year, the Pacers could be even better. Speaking of the Pacers being better, what would they look like if Granger comes back and plays like he did at his peak effectiveness?

image

The Pacers now look like a 57 win team. This may be understating things for the Pacers, too. If Granger is playing like he did 2–3 years ago, chances are that means he’s basically healthy, so he’d likely play more than the 63 games he’s projected to play here. That would push the Pacers win total even closer to the very top of the Eastern Conference. The Pacers, with their revamped bench and the return of Danny Granger to the rotation, look to be a team firmly entrenched in the top 4 of the Eastern Conference. It looks more or less like a four way toss up for which team will be the East’s best in the regular season. For Pacers fans, the more encouraging part of this exercise is looking at how much better their bench now is, to complement their returning starting five, which was the league’s best last year. In the playoffs, the Pacers’ ability to shorten their rotations and play their best five players for longer periods of time is the reason, along with their superior interior play, that the Pacers were able to take the Miami Heat to the brink of elimination. The Pacers now have a bench with competent players to play minutes in the playoffs and not be totally overwhelmed. That change could be the difference between their falling short this postseason and an NBA Championship in the 2013–14 season.

Image from ONE/MILLION via Flickr

Projecting the NBA using xWARP: Miami Heat

The Miami Heat are great. They have been since their big 3 players joined up together 3 years ago. They will almost certainly be great again this year. The question is just how great will they be. Let’s take a look at what the Heat looked like last year from an xRAPM and xWARP perspective.

image

The Heat here look like a 59 win team. So why, then, did they actually win 66 games? Well, there are two major reasons for this. First, they played the easiest strength of schedule in the league — part of that is that they didn’t have to play themselves, part of that is that they play in the weaker Eastern Conference, and part of it was just lucky for them. Second, they won more than their share of close games. It might be that they were a team that was better at executing late in close games, and while there is definitely some of that for this team, these sorts of overperformances tend not to reoccur year-to-year.

Going a little deeper on these two factors, the Heat had an SOS of -.84 according to Basketball-Reference. This means their opponents were, on average, .84 points worse than league average per 100 possessions. Over the course of an 82 game season, that produces an extra 2 wins using the simple margin of victory (MOV) to wins calculation (2.54*MOV + 41 = Wins). In addition, the Heat overperformed their MOV (+7.87) by about 5 games. The Heat, then, performed like a 59 win team had they played a league average schedule. As a result, we should expect some regression to the mean for this team, even without any major changes. Additionally, the Heat have a lot of older (30+) players who project to decline slightly. So what does the projection say for the 2013–14 Heat?

image

The Heat of next year look like … a 59 win team, again. This result should not be terribly surprising. Although they recently amnestied Mike Miller, which will hurt a bit as he is an above replacement level contributor and they have no way of adding anyone else who would be as good as he was and is, the Heat will have a full season of Chris “Birdman” Andersen, who was a pretty amazing per minute contributor (+5.19 xRAPM) in his role for the Heat this past season (and also in the playoffs). As a result, even with a bit of a projected per minute decline in productivity for Birdman (down to +4.79 xRAPM), due to his age, the loss of Mike Miller should not be too damaging in terms of the Heat’s overall regular season record.* Where the Heat may ultimately most miss Miller is in the playoffs when rotations shorten and the loss of a top 8 rotation player will be magnified. The Heat have come quite close to defeat in the playoffs two years in a row and losing Miller is not nothing. He was quite safely above replacement level and he’s one less reliable floor spacer the Heat will have in their playoff rotation. Fortunately for the Heat, they still have LeBron and shortened rotations tend to favor the team with the best player in the world.

After projecting the Bulls, Nets, and Heat, thus far, all three teams look to be very, very strong with the rankings as 1. Nets, 2. Heat, and 3. Bulls. The projections are so close, though, that any number of things could tilt things. If my minutes projections are off, if some major contributor declines much more or much less than I estimated, or if there is a major injury or Jason Kidd turns out to be a lousy head coach, any of these things could upset the projections quite easily. The big takeaway is that all three of these teams should be absolutely great and the top of the Eastern Conference is going to be a total slugfest.**

* I only projected Birdman to play 17.6 minutes per game for next year’s Heat. This seemed appropriate to me, as that is his career average, and he played 15 MPG for the Heat in this year’s playoff run, so I doubt that Coach Spo plays him much more than that, especially given how much the Heat like to keep Bosh at the 5. I think Birdman’s per possession effectiveness is maximized in that role, as he is able to go totally full tilt with the energy and hustle in his limited minutes. So playing him more than that runs the risk of him being worse overall per possession.

**As an added footnote, Hickory High has just released a post today with their full RAPM projections for this year’s rookie class, for this year. I will be using those numbers from here on out. Go read that post, though, it’s great stuff. They don’t change the projections for the Bulls or Nets really at all, as for those teams rookie’s the numbers I used previously look to be about the same and I had projected them all to play such few minutes that they didn’t really change the expected wins of either team.

Image from Keith Allison via Flickr

Projecting the NBA using xWARP: Brooklyn Nets

Last time out, I explained the method I would be using to project the records for the 2013–14 season. There was a lot of dense explanation that I won’t cover again in this post. You can re-read it here. This post will be about updating the method to take into account new research from Jeremias Englemann on aging and RAPM and also to try to project the new rookies entering the league based on projections done over at Hickory High by Cole Patty, Jacob Frankel, and Jam Draper. Finally, I’ll show the updated results for the Bulls and also discuss what this off-season’s biggest splash-makers, the Brooklyn Nets, should look like provided their health holds up.

First up, aging. Aging affects performance, obviously. It cuts both ways. As players get stronger and smarter when they are younger, they tend to perform better year over year. Eventually, usually at around age 30 or so, they start to decline, due to the negative affects of aging and a lifetime of basketball played. Jeremias Engelmann wanted to know the effects of aging on average performance under RAPM. So he did some research and came up with the following graph:

image

As a result of that graph, I decided to add adjustments to the xRAPM of each member of every team based on the expected change in their performance based on the change in their age. Here are the numbers that I used, based on an eyeballing of the graph provided by Jeremias:

Age 19 to 20 = +.6

20 to 21 = +.4

21 to 22 = +.4

22 to 23 = +.35

23 to 24 = +.3

24 to 25 = +.15

25 to 26 = +.1

26 to 27 through 28 to 29 = 0

29 to 30 = -.1

30 to 31 = -.2

31 to 32 = -.2

32 to 33 = -.3

33 to 34 = -.4

34 to 35 = -.4

35 to 36 = -.6

36 to 37 = -.6

37 to 38 = -.75

Second, I wanted to try to get a projection of what rookie performance for this year might look like. I looked around for projections in RAPM of the incoming rookie class and the closest thing I found was 4 years in the league RAPM projections done by the guys at Hickory High mentioned earlier. Unfortunately, 4 year in projections don’t help me for projecting the league for this year. So I subtracted out the RAPM performance bumps those players would have expected to receive via the aging curve over the 3 seasons following their rookie year from their 4th-year RAPM projections to try to approximate a guess as to what their production might look like for this year. It is, admittedly, a janky solution. But it’s the best I could figure for the time being. If I find a better solution, I will change things and post updated results.

Okay, now on to the more fun stuff: projecting the Bulls and the Nets with the updated method.

image

The Bulls look more or less the same as I had previously suggested. Tony Snell’s projection is much worse as the 4-year RAPM projection had him as one of the worst projected players drafted. Erik Murphy looks about the same as I had projected him last time. I don’t expect either of them to play significant minutes so this change had little effect on the Bulls estimated win total. I believe Derrick Rose will play his normal level of minutes as he has had plenty of rest and should be back, better than ever. Rose, Jimmy Butler, and Marquis Teague project to have improvements based on their ages which helps the Bulls, while Carlos Boozer, Mike Dunleavy, and Kirk Hinrich all project to decline slightly. The rest of the major minutes contributors should be more or less the same. As a result, I have the Bulls pegged at about 58 to 59 wins, which is right in between where my two earlier projections of 57 and 60 wins would suggest. So the age adjustment did not make a huge difference for the Bulls.

One team for whom the aging adjustment did matter was the Brooklyn Nets. Prior to age adjusting their roster, the Nets looked like a 63 win team. This is how their projection shook out:

image

After adjusting for age, however, the Nets still look great. They project as a 60 win team, provided they stay reasonably healthy. I made a point of keeping Kevin Garnett’s minutes low relative to his career average, as he has stated in interviews that he can no longer handle the heavy minutes loads that he has been tasked with his whole career. The good news, for Garnett and Nets fans, is that it looks like he will not need to be asked to handle such heavy minutes. The Nets appear to be a juggernaut in waiting. Here are the results with the age adjustment:

image

I have seen the Nets compared to this year’s Lakers as a top-heavy team full of oldsters assembled together to take a shot at a title, with the implication being that the Nets will fall apart just as spectacularly as those Lakers did. I think this is wrong because these two teams could not be more different in terms of roster construction. This Nets team is DEEP. Eight of their top 10 players in projected minutes played are positive xRAPM contributors and ALL of the top 10 in projected minutes played are above the replacement level of -2.5 in xRAPM.

By way of contrast, the 2012–13 Lakers gave over 1300 minutes to Earl Clark (-4.14 xRAPM), 1175 minutes to Steve Blake (-3), plus over 1500 minutes combined to Chris Duhon and Darius Morris (-3.95 and -4.93, respectively). Steve Nash was merely above average (+.7) when he played and on top of that, he was hurt often (hence all the minutes for Duhon, Morris, and Blake). This year’s Lakers squad had little depth and suffered significant injuries to key contributors (Pau Gasol, Steve Nash, and Kobe Bryant) and saw Dwight Howard play when he likely should have been recovering from back surgery. Dwight was awesome (+5.54), but he wasn’t as great as he can be (+8.8 in 2011–12, +9.7 in 2010–11). This is not to say that the Nets will necessarily be much healthier at the top than the Lakers were, but it is to say that they are better prepared to handle injuries thanks to their far superior depth.

If these Nets stay reasonably healthy and Jason Kidd is worth a lick as a coach, they represent a significant threat to the Heat, Bulls, and Pacers at the top of the Eastern Conference. They may even be the favorites to win the regular season Eastern Conference crown, under this analysis, if not in Vegas. Speaking of Vegas favorites, the Miami Heat will be next up in this series of posts.

Image from Keith Allison via Flickr